October 4, 2022
Why churn analysis matters & how to do it well

TABLE OF CONTENTS
TOPICS
RELATED POSTS


Various studies have shown that acquiring a new customer is anywhere from five to 25 times more expensive than retaining an existing one. It’s a big number but hardly surprising; companies have to spend a lot of money on advertising and sales to acquire new subscribers.
With that in mind, you want to do everything in your power to minimize subscriber churn—the percentage of customers that cancel their subscriptions within a specified period of time.
In this article, you'll learn the different ways to analyze churn.
And because we improve what we measure, you'll discover the important strategies you can take to improve this key metric and ultimately drive growth for your business.
What customer churn rate means
It seems simple enough to measure churn: take the number of lost subscribers over a period of time and divide them by the total number of subscribers during the same time frame. So, if you had 1,000 subscribers at the beginning of the month and lost 50 of them, your churn rate would work out to 5% (50 divided by 1,000.) Right?
If only it were that easy.
In reality, determining your customer churn rate can get complicated. For good reason, too. There are a number of ways to analyze churn. What are you trying to learn about your lost customers and your business? Picking the churn methodology that is most applicable to your company and what you want to discover is the surest path to ultimately improving your bottom line.
Here are a few factors to consider:
Over which time period are you trying to measure churn? In the above (oversimplified) example, we looked at monthly churn. But you could also choose to measure churn over the quarter, year, or any other given time period.
What questions are you trying to answer? There’s a big difference, for example, between churn in Q2 versus churn in Q3 and the change in churn year-over-year.
If you have different product lines and customer segments, your churn rates are going to vary across them. Should you look at all of your customers together or break them into customer segments?
What qualifies as churn? Is it when a customer cancels—which can be weeks or months before their subscription expires—or when they actually stop paying you?
We will go into more detail on these churn analysis considerations. But next, we’ll explore why you need to measure churn and the different kinds of churn.
Does every subscription business need to measure churn?
Yes. Every company has a churn pattern. Understanding it is critical to unlocking the overall profitability and health of your subscription business. Some of the fastest-growing companies owe much of their success to low churn risk. Netflix, for example, has single-digit churn rates.
While it’s impossible to eliminate all of your churn, there is an acceptable amount of churn and an unacceptable amount of churn. That will vary depending on your industry and customer type—more on that later.
Churn turns into higher customer acquisition costs, reduced revenue, and worse
Your churn rate impacts some of the most important metrics for your business:
Monthly recurring revenue (MRR) is your business's lifeblood. However, your company will struggle if your churn's MRR (the monthly revenue lost due to churn) is higher than your MRR.
Customer lifetime value (LTV) is your company's profit from the average customer over the period they remain a customer (from signup to churn). Here’s how you calculate it: (average revenue per customer x gross margin percentage) / customer churn rate.
Customer acquisition cost (CAC) estimates how much you have to spend to acquire a new subscriber. Customer acquisition is typically an expensive endeavor, which motivates companies to focus on retaining their existing ones.
There are other metrics, but these three are a solid starting point. You can even look at some of them in conjunction to get more detailed churn analytics. The LTV:CAC ratio, for example, is a way to look at the return on investment (ROI) for customer acquisition.
Churn analysis is a valuable tool for any subscription business, but it needs to be deployed in the proper context. Churn rate is a trailing indicator, which means that efforts to improve it will not be immediately reflected in the metrics. As stated earlier, churn rates need to be broken out by product line and customer segment—but that’s not the only way to write a customer churn analysis.
Calculating churn: Essential steps
First, you need to determine when you will consider a customer to be “churned.”
Is it when they cancel their subscription? Or when the subscription ends and it isn’t renewed?
We recommend that you don’t consider someone to have churned until their subscription ends and isn’t renewed. Assuming you have solid processes in place, you can win back a lot of these subscribers between the time they hit “cancel” and the time their subscription comes up for renewal. (If someone involuntarily churns, you can also win them back—if you know the right way to recover failed payments. More about that later.)
After you set a precise definition for “churn” in your business, you have to decide how you will count your customers. This is key to analyzing churn.
In any given time frame, you have three customer types:
Those that signed up prior to the time period and will come up for renewal in the current month
New customers who signed up
Newly churned customers
Through an example, we can illustrate how this works in practice. Let’s say you offer flower subscriptions and want to calculate your monthly churn rate.
You start off on February 1 with 9,000 subscribers in San Francisco. That's type no. 1.
Thanks to a boom in business around Valentine’s Day, you acquire 1,000 subscribers in February. Type no. 2.
Now, type 3. Over the course of the month, 200 subscribers fail to renew their subscriptions before expiration.
You end the month with 9,800 subscribers.
So, what's your churn rate?
Customer churn rate
Number of subscriber that quit divided by total number of subscribers over a time period
As stated above, the churn rate is calculated by taking the number of churned subscribers over a period of time and dividing it by the total number of subscribers during that period of time.
Your churn rate will vary depending on when you count your subscribers.
While some companies use a midpoint or month-end total, Recurly uses the number of subscribers at the beginning of the month.
So, the San Francisco flower business would have a churn rate based on losing 200 subscribers in February while starting February with 9,000 customers.
The churn rate would be 200/9,000 = 2.22%.
Non-subscriber churn rate
Number of customers considered inactive in a given time period divided by total number of non-subscriber customers
This churn rate tracks how often you're losing customers who would make a non-subscription-based purchase. Even if they're not subscribers, can you really say they churned? Absolutely.
Depending on your specific subscription business, you may offer single, one-time purchases. Consider that one-time purchase as a possibly repeatable action. It's not a subscription, but customers are creatures of habit. Suppose you find that most customers make such a purchase at least once every three weeks, like a special flower purchase in addition to their subscription.
So look at all your customers who have not made a purchase in three weeks (i.e. turned inactive) and divide it by all the customers who have made a non-subscription-based purchase.
Now, you're looking at how many repeat shoppers you're losing, and you can do something about it.
Revenue churn rate
Recurring revenue lost in dollars / total dollars of recurring revenue at start of period
Measuring your revenue churn rate acknowledges one important fact in the subscription business: Not all subscribers have the same value.
To get your monthly churn rate, divide your monthly recurring revenue (MRR) in dollars by the difference between your lost MRR and any upgrades from current customers.

Whatever your customer attrition rates, the incoming monthly revenue will tell you an important story about whether you're refining your products and services toward something of greater value (that your current customers) will upgrade to.
Suppose the San Francisco flower business has a premium monthly plan and a basic monthly plan.
Suppose the 200 churned customers from above were all part of the premium plan. That would hurt your monthly recurring revenue more than if they were all part of the basic plan.
The reality is that losing 200 subscribers in any month will be more of a mixed bag.
Look at the MRR from your 9,000 starting customers minus the MRR lost from those 200 churned customers. Meanwhile, some fraction of your starting 9,000 subscribers might have upgraded. Take them out of the equation. You want to see how churn rates affected your revenue and avoid customer upgrades from clouding that view.
Taken with your customer churn rate, your revenue churn rate will give you valuable insights into whether your business is developing your customer base and turning input from customer feedback into high-dollar products your subscribers will pay for.
You'll also see if you're losing valuable subscribers hidden in your aggregate churn rate.
Now, in the above example, we calculated the monthly churn rate, but that isn’t necessarily the best option for all. A company with a business model heavily affected by changing seasons, for example, may want to measure churn over a longer period of time to decrease the potential for distortions.
Seasonality, it turns out, isn’t the only potential distortion in churn rates.
Analyzing churn rates: Cohorts & segmentation
We’ve established that churn analysis can’t be distilled into one metric.
Creating customer segments are two more steps you should take to analyze churn for your subscription business.
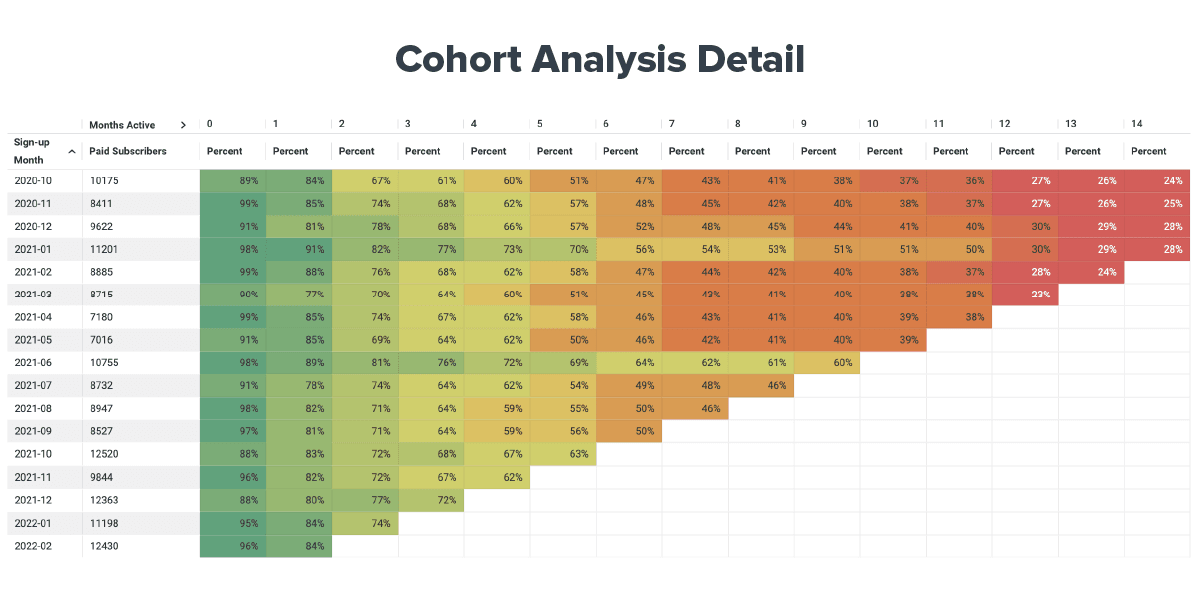
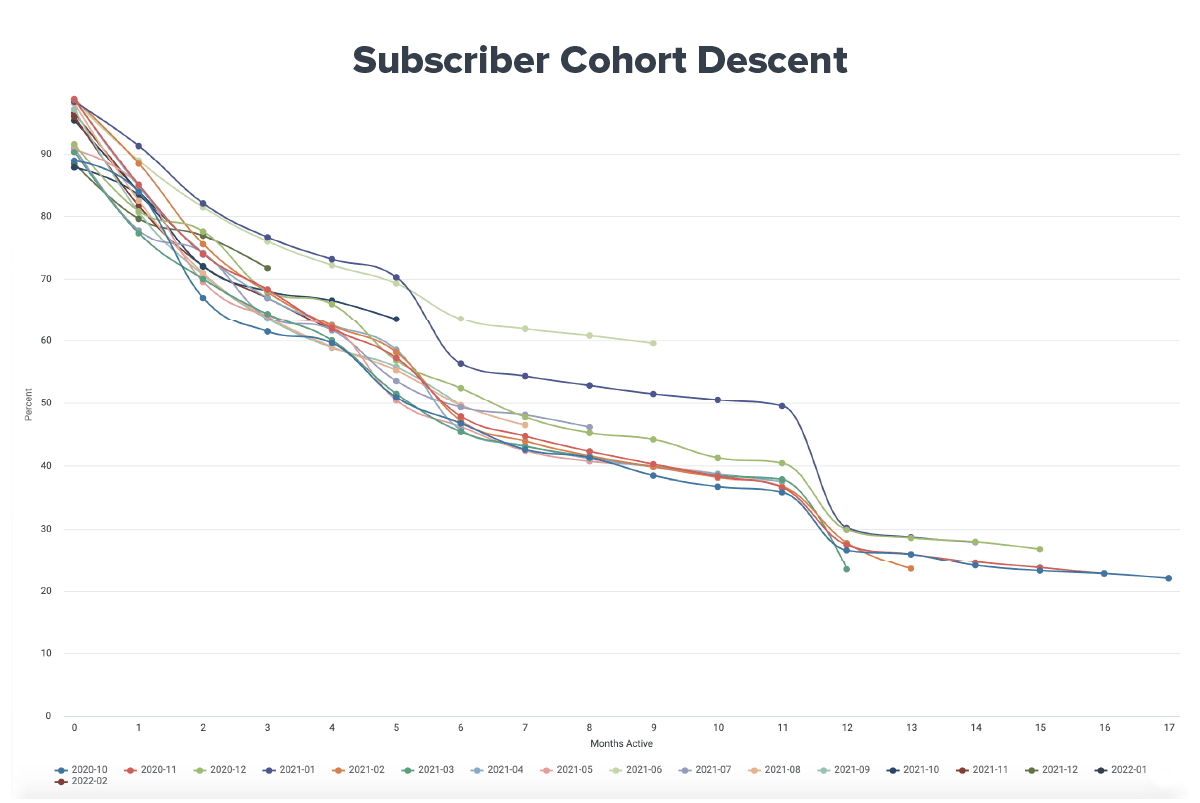
A cohort analysis gives you a greater understanding of churn, such as when your subscribers are churning in their lifecycle. Are they leaving after two months or six? Maybe they’re leaving at a certain time of the year. By breaking your customers down into cohorts, you can learn who is churning, why they’re churning, and when they’re churning.
You can derive actionable insights from the results of that analysis. From there, you can strategically target a certain timeframe—i.e., a particular cohort—in the subscriber lifecycle to try to reduce churn.
It’s not just about when your customers are churning, but which of your customers are churning. After all, not all customer experiences are the same.
Let’s say half of your customers are individual consumers, and the other half are enterprise clients. The individuals have a churn rate of 18% for the year. On the other hand, your enterprise clients have a churn rate of 2%.
So would you take the average of 2% and 18%, and say that's your annual churn rate? No, the average churn rate of 10% would be downright misleading.
Instead, keep those customer churn rates separate.
You’d want to look at the churn rate for each type of customer and target them differently. The same goes for product lines, particularly if your company’s offerings are diverse. (Here are some benchmarks to see if your business's churn is in a healthy range.)
Finally, break down your business data further by comparing the types of churn. Customers churn for one of two basic reasons: voluntary vs. involuntary churn.
If a customer initiates their exit, chances are they are not happy with your company’s offering or aren’t getting enough value out of their subscription. A high voluntary churn rate may indicate that your company needs to change its pricing, product offerings, or other aspects of your go-to-market strategy.
A customer may voluntarily cancel because they don’t want to pay for their subscription right now. Maybe they’re busy or they just lost their job. According to PYMNTS.com, around 25% of consumers who are likely to cancel their subscriptions would pause their subscription if the option were available.
By using a subscription billing management platform that enables a pause feature, like Recurly, you can alleviate a hefty number of voluntary cancellations.
The second churn type has nothing to do with customer loyalty.
Involuntary churn happens when a customer leaves your business because of a missed payment, credit card issue or other problem unrelated to customer satisfaction. If your company’s involuntary churn rate is high in a particular region, for example, consider fighting high payment declines by optimizing your gateway strategy.
Involuntary churn isn’t an indictment of your business, but it is an indictment of your billing system. This type of churn is one of the biggest enemies of a subscription business because you’re unnecessarily losing customers. Involuntary churn is extremely common, accounting for 53% of churn on average.
That means more than half your subscribers could be leaving you without meaning to.
The best way to minimize involuntary churn is by implementing a top-notch billing management platform. Recurly reduces its merchants' involuntary churn rates from 6% to 1% on average. In 2020, Recurly helped subscription companies recover a total of $610 million in revenue.
Learning how to analyze churn isn’t as simple as it appears at first glance.
The insight is worth the work. Conducting a comprehensive churn analysis is one of the best ways to assess the health of your subscription business. By understanding churn key performance indicators (KPIs), you can potentially increase your company’s MRR and LTV:CAC—and fuel continued growth.
How often should you measure churn?
You could choose to measure churn over any time period—monthly, quarterly, annually, etc. It can be time-consuming to constantly measure churn on your own, though. Look for a subscription billing management platform that helps you calculate churn rates.
Get more insights to minimize churn and maximize revenue
Churn is one of the most sensitive indicators for subscription businesses as slight differences in churn rates can have significant impact on revenue growth and the overall health of a business.
This comprehensive guide shares key drivers to cut involuntary churn rate to 1% and boost subscription revenue by 11% MoM.