Smarter subscription analytics
Gain all-around visibility into the subscription metrics that matter, with the interactive analytics dashboards and comprehensive subscription reporting of Recurly.
Make informed decisions for growth with quick, customizable, and extendable access to your unique subscription model
Gain action-ready insights
Built-in dashboards and reports provide a 360° view into the health of your subscription business—from plan performance, customer base trends, campaigns results, and subscription revenue per user—to quickly inform your data-driven decisions with actionable insights.
Customize your own reports
Uncover new insights in one subscription management platform. Subscriber acquisition, popular pricing plans and customer retention rates. Plan and promotional campaign performance with an easy-to-use tool that allows you to share visual dashboards and reports with your marketing and sales teams.
Dig deeper with data imports and integrations
Get data where and when you need it with ready-to-go dashboards, automated data exports, and robust APIs that connect leading data warehouse applications that help you get—and share—a full picture of your subscription-based business in one subscription management solution.
Key features
Grow smarter with access to subscription analytics, KPIs, and graphs to help you optimize your plans, subscribers, and revenue.
See the big picture with little effort
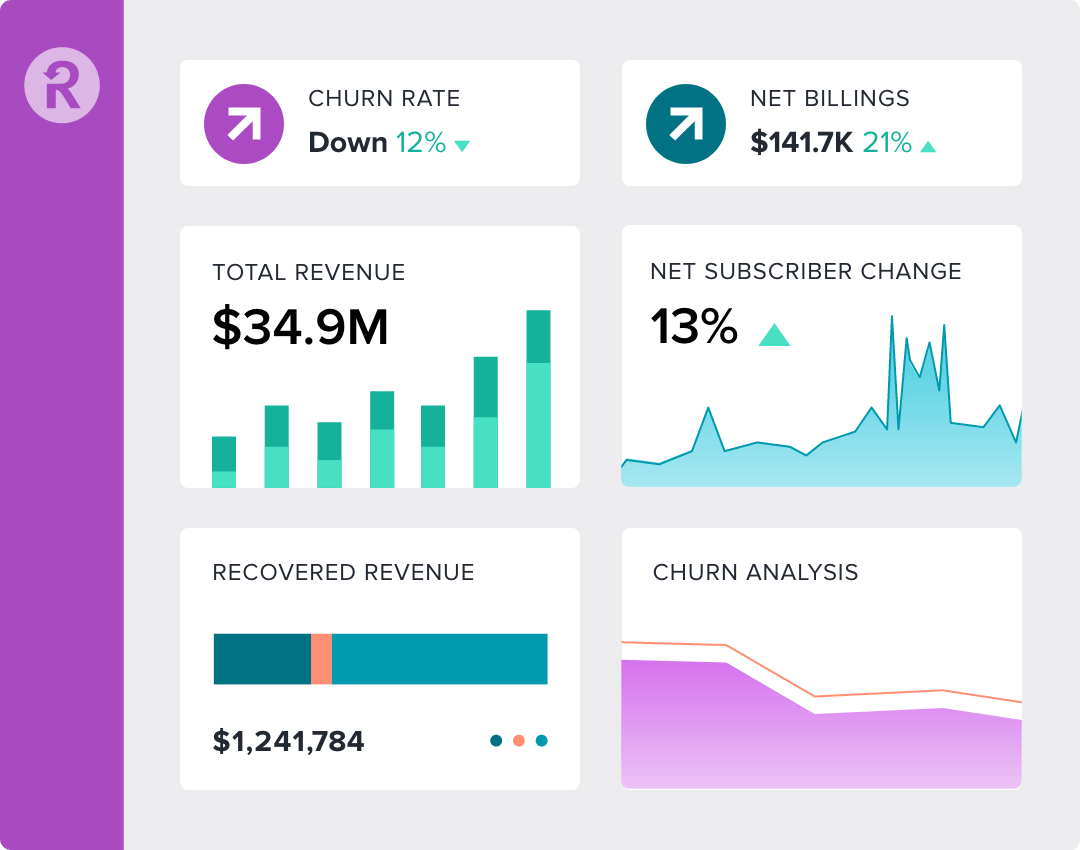
The analytics dashboard presents a high-level snapshot of your subscriber base, churn rate, plan performance, billings, and revenue—key metrics that depict the overall health of your business.
- 360° view of subscriber data
- Real-time metrics to inform decision making
- Trend and opportunity identification


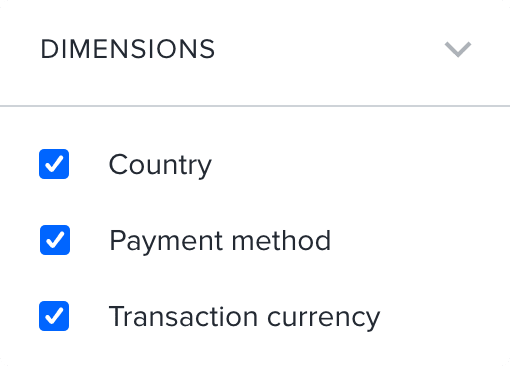


Build it your way
Recurly Explore report builder is a powerful tool that allows you to easily create custom insights into your business. Use builder to generate a dashboard that can be downloaded, and that combines the metrics you care about most.
- Customize reports and cohort dashboards for reporting
- Live search for quick account detail lookups
- Download custom reports for further analysis
- Pair metrics with custom fields to deepen insights
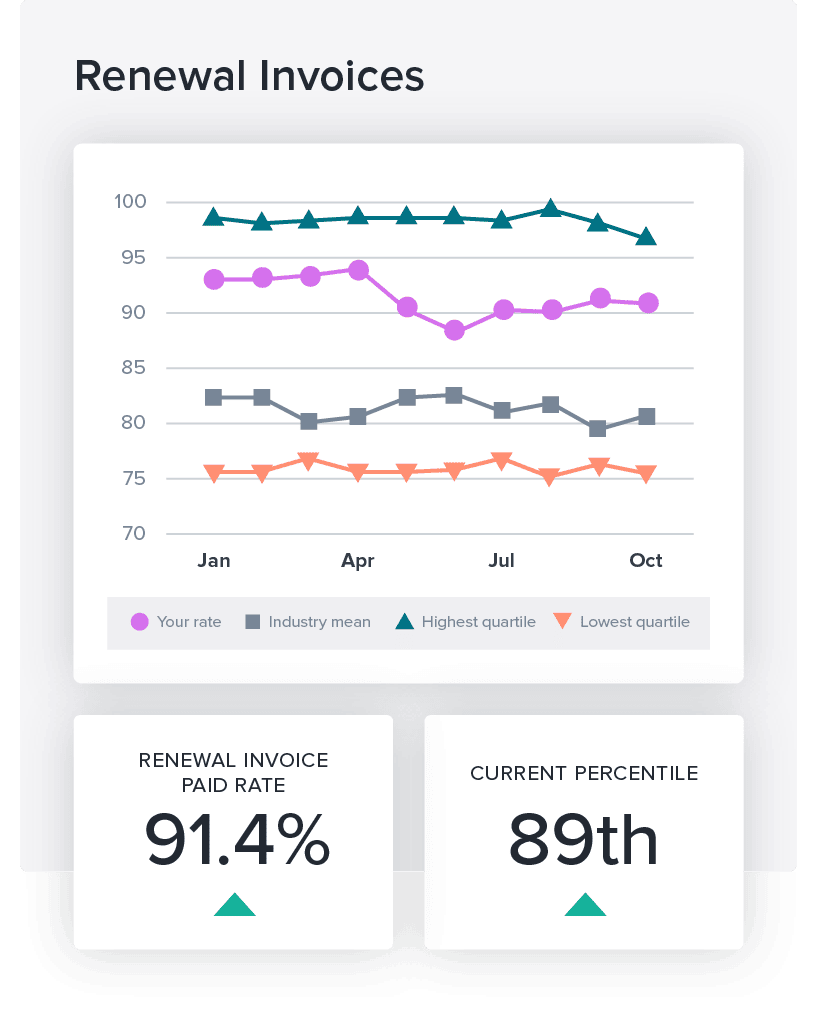
See how you stack against competitors
Recurly provides built-in benchmarks to compare your performance against the industry. See how you're faring against similar companies to prioritize strategies and grow your subscription business.
- Includes subscription acquisition, churn (voluntary and involuntary), dunning recovery rates and more
- Displayed as a percentile that's calculated by a variety of metrics
- Compare against the industry median and top and bottom quartiles
- See how you're trending across a specific timeline

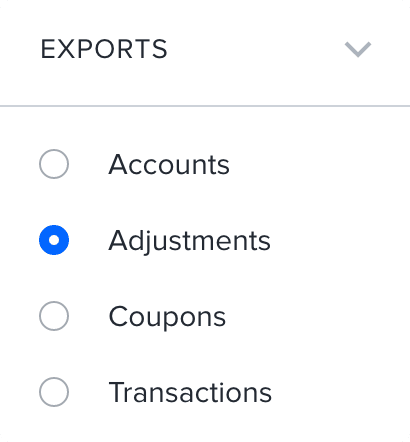
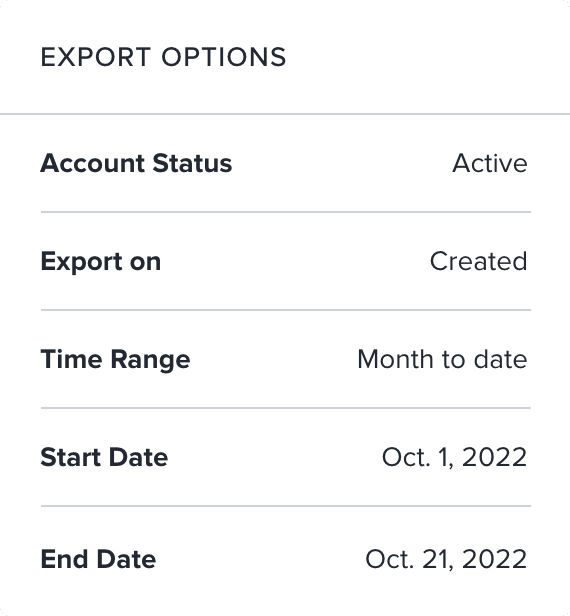
Share data across platforms
Leverage your subscription data across the enterprise by configuring automated exports and tapping into APIs that link data warehousing tools. Pair exports with custom fields to unify data from disparate systems to deepen reporting.
- Schedule automated exports
- Leverage powerful data warehousing APIs
- Pair with custom fields to deepen insights
Identify growth opportunities with advanced subscription analytics
Gain deep insights into business performance with advanced subscription management tools displaying your critical metrics via charts, tables, and graphs that allow you to optimize what’s working and tweak what’s not. Running your subscription services with Google Analytics isn’t the answer for any subscription business model that wants to succeed at the pace of today.
Learn more about reporting & analyticsSubscriber growth and retention
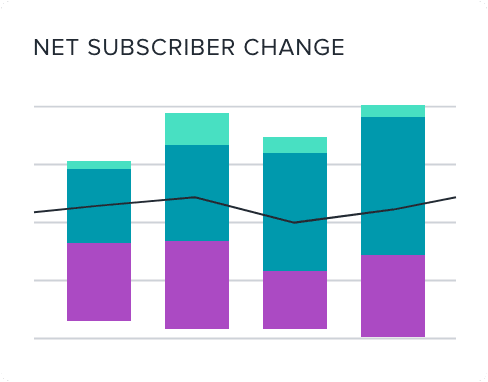
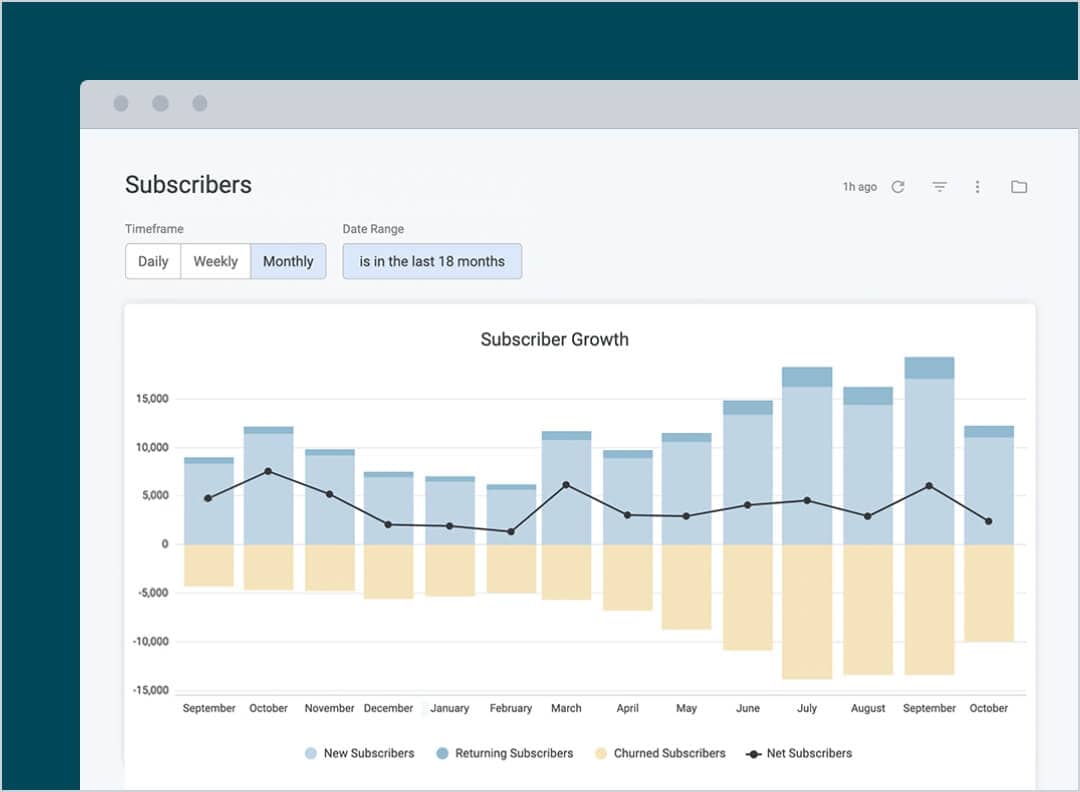
Get a view of total active subscribers and monthly revenue, and track active subscriber growth and customer churn, to identify conversion rate trends and gain better customer experience insights with a proprietary cohort analysis showing active and churned subscribers over time.
Filter to see daily, weekly, or monthly numbers of active accounts and subscribers, adjustable for your preferred date range.
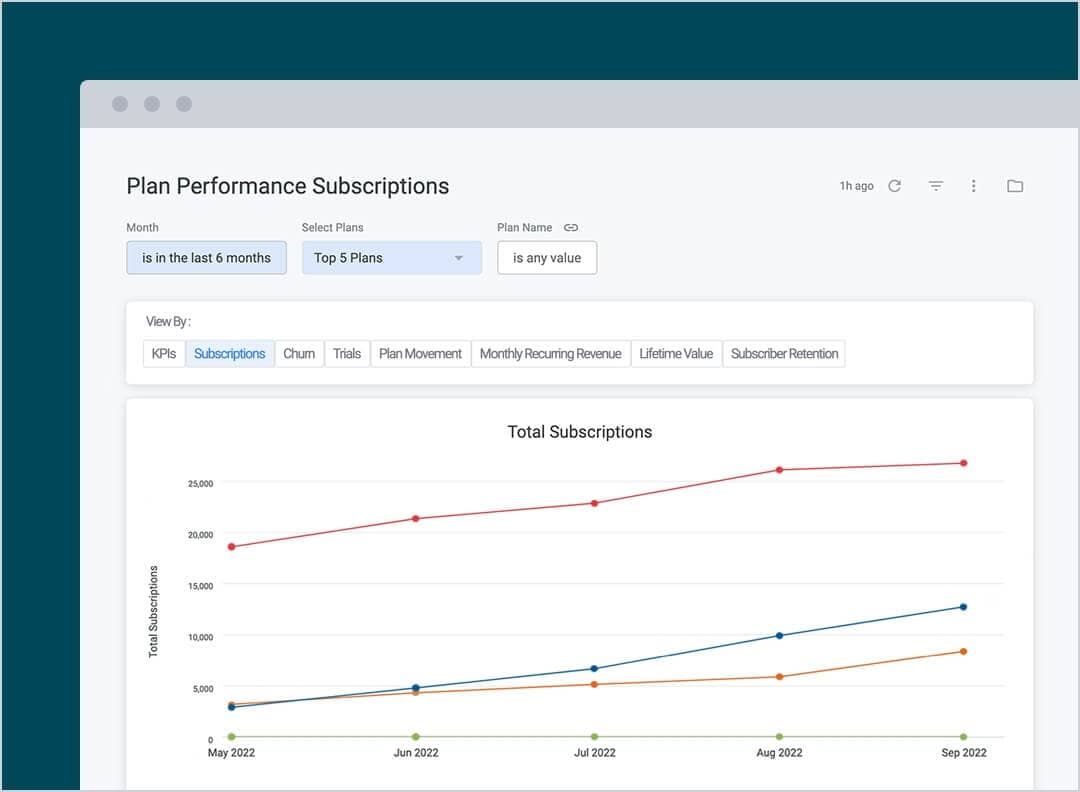
Plan performance
Evaluate the performance of a plan after pricing, plan length, or promotional changes. Marketing campaigns and trial subscriptions can be invaluable for developing additional products that inspire customer loyalty.
Compare attributes of different plans, such as trial management strategies or plan length, to gauge which plan is most successful.
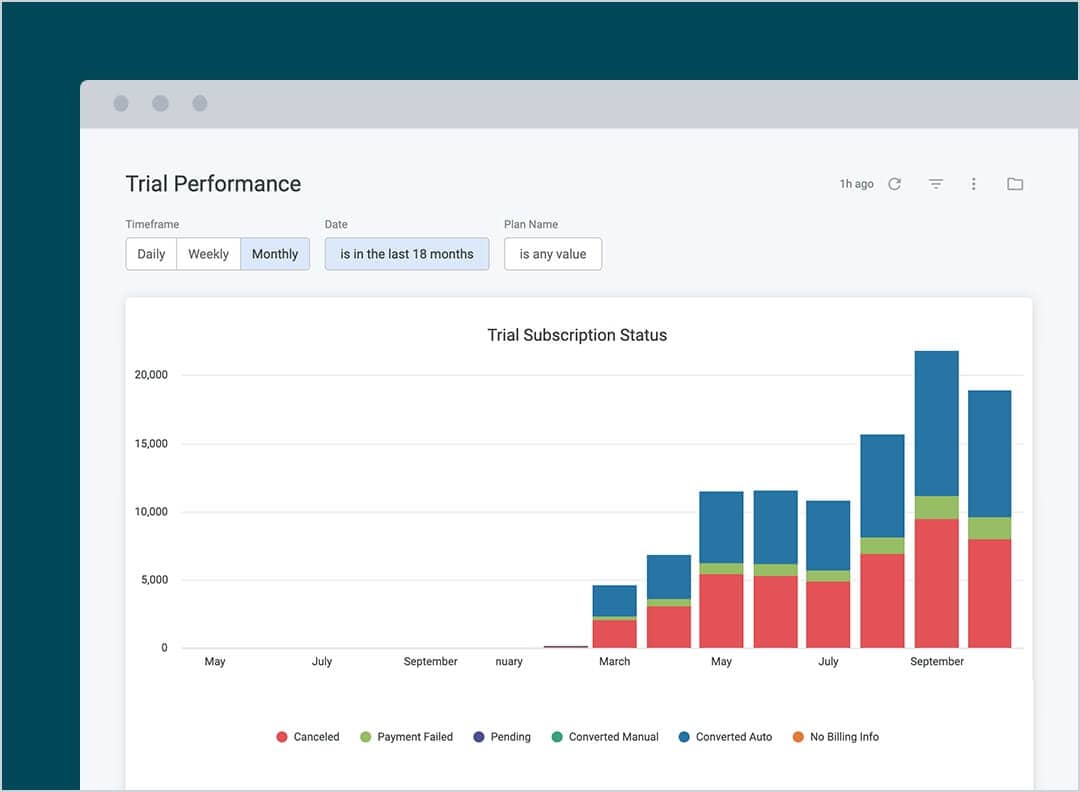
Trial performance
Track the performance of your trial subscriptions and monitor the conversion rates from trial to active subscriptions over a given time frame.
Gain an overview of trial performance key performance indicators, conversion rates, subscription status, and subscription details.
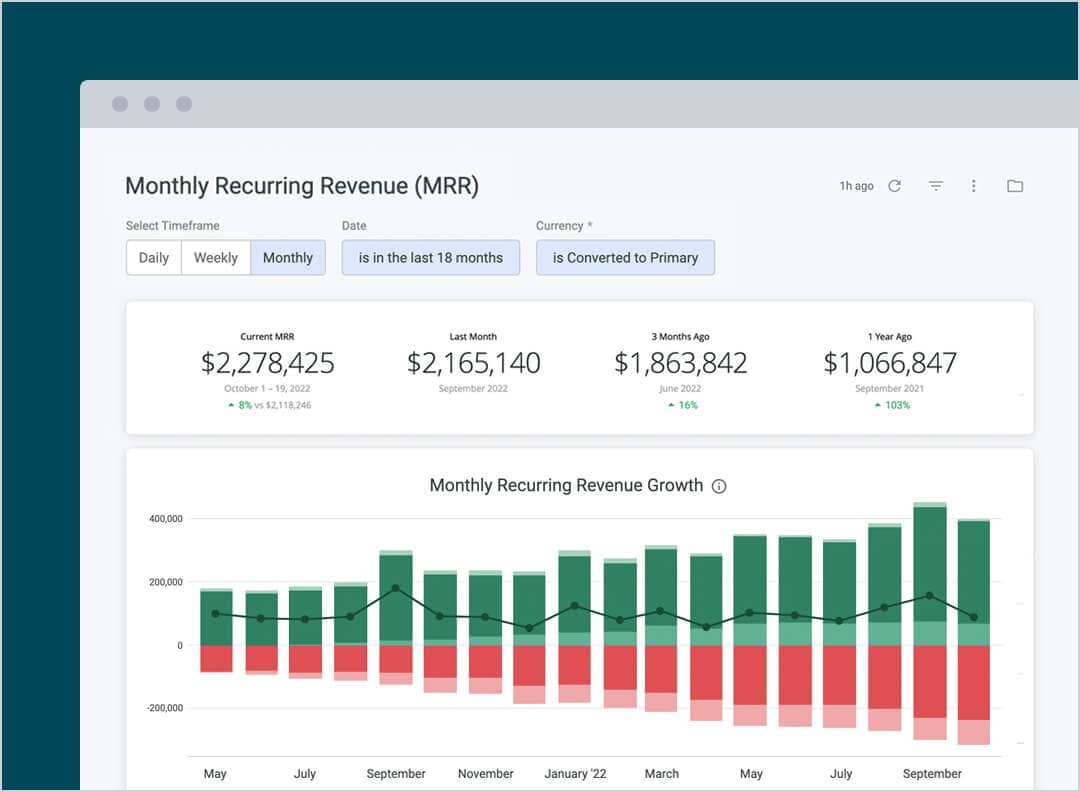
Monthly recurring revenue (MRR)
Measure the predictable revenue a business can expect on a monthly basis by tracking total MRR and MRR changes.
These detailed insights help you monitor and evaluate your business growth and revenue momentum.
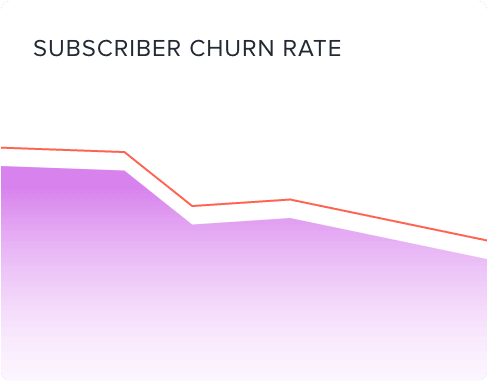
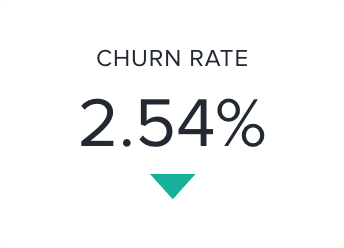
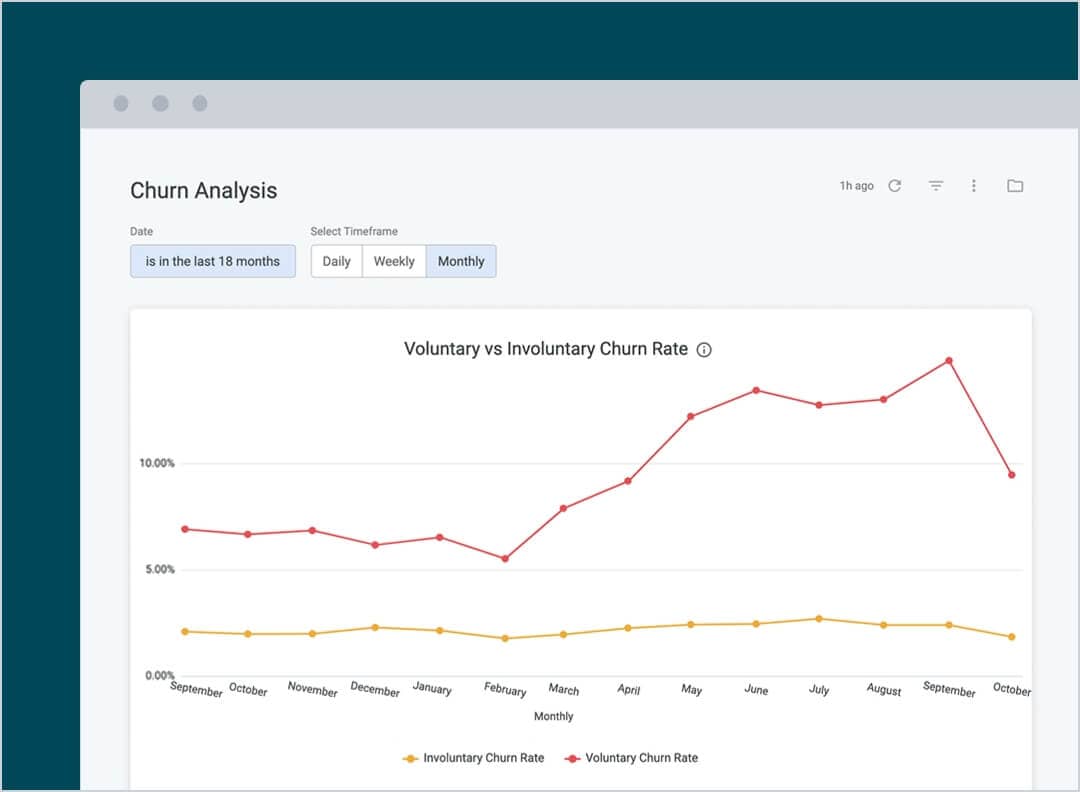
Churn analysis
A must-have for every analytics dashboard for your subscription billing team. Calculate and monitor the total number of subscriptions that expired during a selected time period, by expiration reason, either voluntary or involuntary churn.
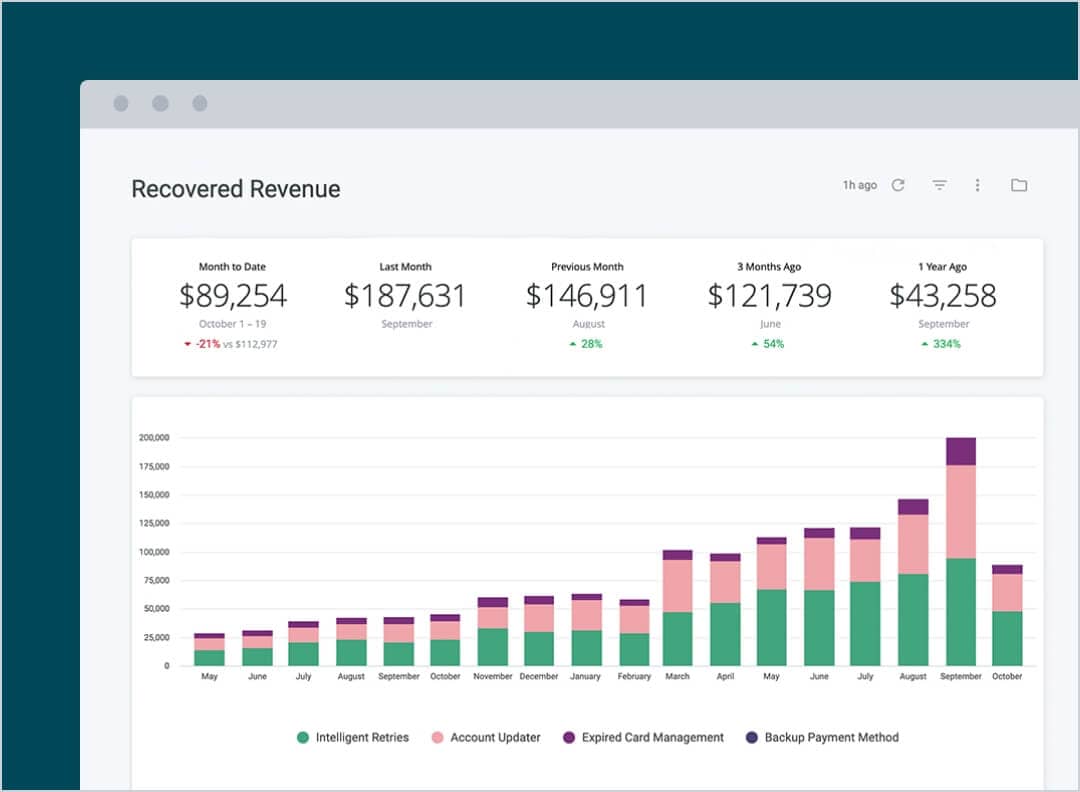
Recovered revenue
Calculate and report the amount of total revenue recovered by minimizing involuntary churn from declined transactions, segmented by recovery method:
- Intelligent retries
- Account updater
- Expired card management
- Backup payment method
Experience matters. Enjoy unmatched, proven scalability with Recurly.
2,200+
global brands on Recurly
>63M
active subscribers on Recurly in 2023
$12B
annual total payment volume
$1.3B
annual recovered revenue

Recurly’s analytics suite does a lot of the things we’ve been doing manually but much more beautifully, accurately and easily.
Read case studyFrequently asked questions
What are subscription analytics?
Subscription analytics pull together all critical subscription data for easy review and analysis. There are critical metrics that businesses should monitor surrounding customer acquisition, subscriber revenue, and retention. Read more about subscription analytics best practices.
What is subscriber data analysis?
Subscriber data analysis is the process of analyzing data about customer subscriptions to determine trends and opportunities. Subscriber actions paint a picture of the complete customer lifecycle, and seeking valuable insights into subscriber data is one of the cornerstones of success.
What metrics are most important for subscription businesses?
There are a number of metrics that subscription businesses find valuable, including monthly recurring revenue (MRR), recovered revenue, involuntary churn, dunning activity, and subscription plan performance. You have a wide variety of metrics to study the flow of payment collections and the various behaviors of your subscribers. As you manage revenue leakage and shape your pricing strategy, you’ll improve the user experience and uncover which billing plan matters most for the greatest number of subscribers.
Which tools are most useful for subscription analytics?
Successful subscription business analytics tools are capable of analyzing large amounts of data quickly and presenting the data in flexible, easy-to-consume formats such as dashboards, reports, and graphs.
What is the difference between cohorts and segments in subscription analytics?
Cohorts are customer groups that share common characteristics over a period of time, such as billing cycles or a specific event, like a plan or promotion. For instance, a cohort that used the same payment option during December could suggest changes to the billing platform during holiday months. That’s a ripe topic for cohort analysis. Segmentation is the process of dividing customers into groups based on shared characteristics or behaviors not related to a timeframe or event. Subscribers who have or haven’t downloaded your mobile app or have different behaviors with a certain payment option can all be segmented to give you deeper insights into your business. You may uncover a high bounce rate for customers who never use the mobile app or a surprising behavior that could inspire a new marketing strategy for your product managers. Both are valuable analytics methods for subscription businesses.
Recommended resources


Get started with Recurly
