Explore the data
What is customer churn?
Churn is a fact of life for any subscription business, and slight fluctuations in churn can make a significant impact on your current and future recurring revenue.
Often mistaken for turnover, churn refers to subscribers who either voluntarily cancel or fail to pay and are involuntarily removed, whereas turnover refers to the total revenue your business acquires from its goods and services. Both are calculated over a period of time, but turnover is related to profit generation, while churn is related to customer behavior.
So when do you count a customer as churned? While you can define the timespan in which a customer churns, typical methods to determine when a customer has churned include the date when the current subscription period ends after the point of cancellation and the end date of a subscription that has not been renewed.
Benchmarking: How does your business churn rate compare?
Your churn rate is a critical indicator of the health of your subscription businesses. Monitor this rate closely for unusual changes that could indicate a problem in your subscriber lifecycle.
Overall churn rate: 3.27%
Business churn rates vary widely, and minimizing churn is key to any subscription business's growth and long-term success.
Voluntary vs. involuntary: 2.41%, 0.86%
Voluntary churn indicates changes in customer preference, while involuntary churn points to payment issues.
What is the average churn rate for SaaS?
For a subscription company, the average monthly churn rate is 1-5%, and a 4% monthly churn rate is considered a good benchmark. However, the average churn rate for any business depends on the market and your industry, so keep reading to see industry benchmarks that can be used as a barometer for your business.
How to minimize business churn rates: Voluntary vs. involuntary churn
Different factors lead to different kinds of churn—each requiring a specific approach. Improving the subscriber experience reduces cancellations that result in voluntary churn, while using decline management techniques minimizes payment declines that lead to involuntary churn.
We found that 54.5% of Recurly’s customers experienced decreased overall churn rates compared to the previous year. In 2024, Recurly’s data analysis showed that businesses offering tailored retention-driving options such as pause features, tiered pricing, and loyalty incentives are more likely to sustain a Renewal Invoice Paid Rate (RIPR) of 95.6%. The effective use of our churn management techniques such as card updaters, intelligent retries, dunning management, and more has provided merchants with an average 16X ROI.
44.1% of businesses saw a decrease in voluntary churn rates compared to last year, demonstrating that recurring revenue businesses need to address both types of churn to effectively reduce their overall customer turnover.
Learn more about how to minimize churn rate & maximize subscription business revenue.

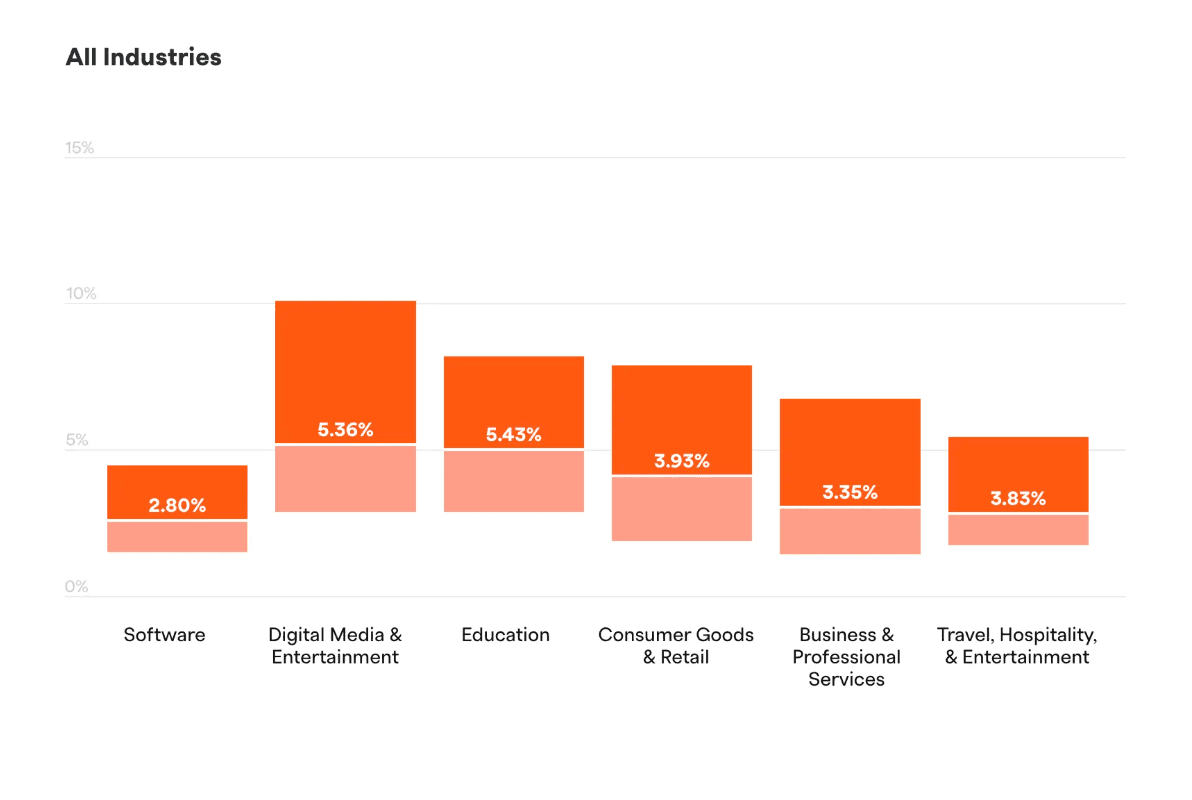
Business churn rate by industry
Different industries have different factors that influence churn behavior. Understanding these factors can help you formulate effective strategies to proactively fight churn and keep it at bay.

As consumers become more selective and price-conscious, customer acquisition slows and churn follows. In general, direct-to-consumer (DTC) subscription businesses experience higher customer churn rates than business-to-business (B2B) businesses. Digital Media and Entertainment, Consumer Goods and Retail, and Education industries have an average churn rate of 6.5%. In contrast, their B2B counterparts–Software and Business & Professional Services–have an average churn rate of 3.8%.
Analyzing churn rates on an industry-specific basis is essential, as various factors influence voluntary churn. These factors range from pricing and convenience to the usability of the product or service, making the perceived value of a subscription subjective to each subscriber, especially in the DTC industry. Consumers tend to be more price elastic, with even minor price adjustments potentially causing major shifts in demand and impacting customer lifetime value.
In contrast, companies in the B2B industry typically provide products or services that are integral to their customers' operations–other businesses. Therefore, these customers are typically in better financial health and are more inclined to make long-term investments in their subscriptions.
Recurly helps its customers recover $1.6B in revenue annually. How much revenue could you recover?

Churn rates by average revenue per customer (ARPC)
Undoubtedly, price impacts churn. Our research found that 71% of survey respondents cited price increases as the number one reason for loss of customers. Subscribers both signup and cancel more readily in categories with lower price points.
Understanding the different factors that drive churn is the first step. Taking action is the next step.