Key subscription business metrics

Monitoring acquisition, revenue, and retention numbers are vital to your business's success. Metrics provide valuable insights into your company, offering a clear understanding of its performance and helping you make informed decisions.
By monitoring key performance indicators (KPIs), businesses can assess their financial health, identify areas of improvement and expansion, and measure their strategy effectiveness.
Ultimately, the regular analysis of subscription metrics empowers you to adapt to changing market conditions, stay competitive, and achieve revenue growth in the long run.
Where can you start? Here's the list of 11 essential metrics and KPIs for subscription businesses–with their formula.
Customer acquisition cost (CAC)
CAC is the estimated cost of acquiring a new subscriber, including marketing, sales, and headcount. CAC is essential for assessing subscriber ROI (return on investment), since it tells you if your customer acquisition strategies are working and how much you're paying for your active customer base.

LTV:CAC ratio
When combined with lifetime value (LTV), CAC helps to answer how much profit you get for every dollar your company puts into sales and marketing channels.

Calculating your LTV:CAC ratio is an excellent way to see if your subscription company is positioned for sustainable growth. LTV that exceeds CAC means your acquisition campaigns are profitable.
A good benchmark is 3:1 or better. Generally, 4:1 or higher indicates a great business model. If your ratio is 5:1 or higher, you could grow faster and likely under-investing in marketing.
Payback period
Your payback period is the average time it takes for CAC to be recouped through monthly recurring revenue (MRR).

Tracking your payback period is essential as it helps you to accurately forecast how long it will take to "payback" the cost of acquiring each customer based on the MRR.
The payback period answers questions such as:
Is my CAC on target based on how long each customer will take to reach the "break-even" point?
How long will it take to achieve payback, and what are the implications for capital?
Trial conversion rate
This metric measures the rate at which users who sign up for a free trial version of your product become paying subscribers.

It’s important to consider the trial length and the costs you'll incur by offering a free product compared to the value you'll gain from the trial users converted. Trial conversion rate can address questions such as:
How effective is my free trial at converting users to paid subscribers?
When combined with the LTV of trial subscribers that converted to paid, how successful is my trial at producing valuable subscribers?
How do free trials impact conversion to paid subscriptions?
Across the board, subscription trials are a great conversion tool. According to our State of Subscriptions report, the median trial-to-paid conversion rate reached 50.0% in 2023. Consumers highly favor trials, as they allow them to test a product or service before committing to a subscription. This is evidenced by our What consumers want study, which shows 75.0% of respondents are more likely to subscribe if a free trial is offered.
Monthly recurring revenue (MRR)
Monthly recurring revenue is the predictable revenue a business can expect every month–including all invoiced recurring charges, credits, and refunds from active subscriptions. It typically excludes one-time charges, taxes, and other variable fees.

Often considered one of the most valuable metrics in the subscription business model, this metric can help answer questions like:
What is the growth trajectory of my business?
How is customer acquisition or subscriber churn impacting my monthly revenue?
Lifetime value (LTV)
LTV is an estimate of the profit made by the average customer over the period that they remain a customer (from signup to churn).
It represents the upper limit on how much you should spend to acquire new customers–helping you make key business decisions related to sales, marketing efforts, and other important investments.

Customer lifetime value helps to answer questions such as:
Who are my most valuable and least valuable customers?
How much money should I spend to acquire new customers and maintain profitability?
How much money should I spend to support and retain a customer?
Return on investment (ROI)
Your return on investment measures how much profit you receive from your subscriber base. Helping you understand the true nature of their growth and if it’s sustainable.
You might have a high LTV, but it’s only sustainable if your customer acquisition cost is lower than the customer lifetime value.

Average revenue per user (ARPU)
Average revenue per user tells you how much revenue is received, on average, from each of your subscribers. This metric provides a quick glimpse into the value of your subscribers and can be an indicator of overall growth.

Quick ratio
This ratio shares a company's ability to grow recurring revenue in spite of churn.

The quick ratio indicates a company’s short-term liquidity position and measures its ability to meet its short-term obligations with its most liquid assets.
According to Investopedia, 1 is the standard. A company with a ratio of less than 1, may be unable to pay off its current liabilities in the short term. A quick ratio higher than 1, can instantly eliminate its current liabilities.
Subscriber churn rate
Churn rate, also known as attrition rate or turnover rate, is a critical metric in subscriptions. It’s the percentage of subscribers who canceled or didn’t renew their subscriptions in a given period.

It indicates how well your business retains subscribers and how valuable they find your product or service. The higher the churn, the more customers and revenue you lose.
Subscription businesses lose 4.1% of their customers monthly–3.0% voluntarily and 1.0% involuntarily. However, customer churn rates varies widely depending on the industry, audience, and price point.
Calculating churn is related to how you count subscribers and activations. Learn how to better calculate churn for your business.
Churn monthly recurring revenue (MRR)
Churn MRR is the monthly recurring revenue lost due to cancellations–based on churned revenue, not churned customers.

Churn MRR is an excellent metric for companies with different price tiers. One customer can generate $10 per month, and another can generate $500.
Looking at the number of cancellations doesn’t show you the impact the cancellations have on the bottom line. Looking at churn MRR does. It adds meaning to the number of cancellations there are.
What's the most accurate way to study your KPIs?
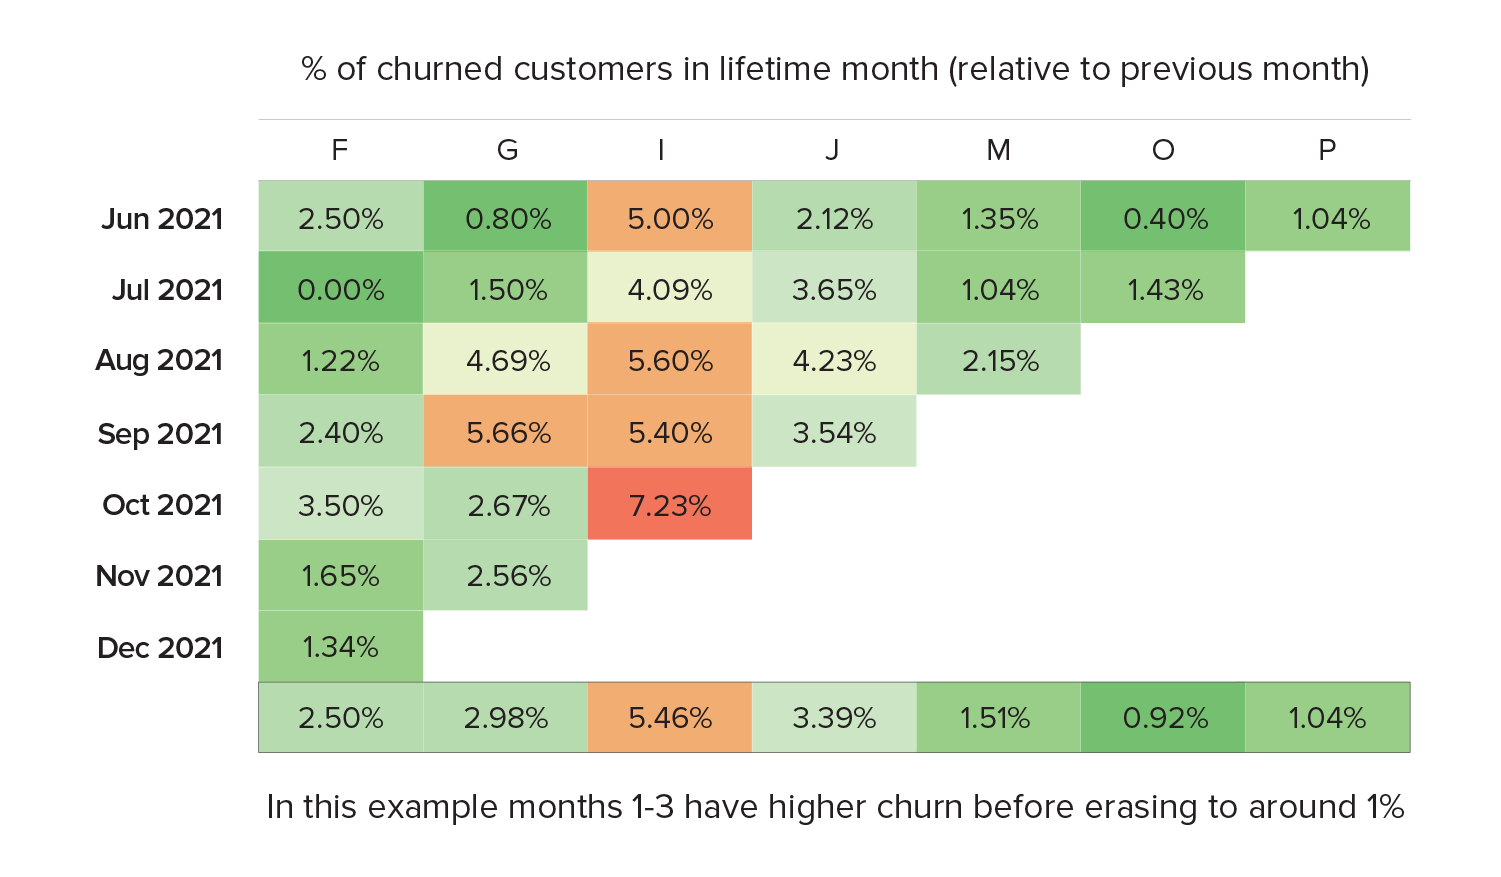
A cohort analysis involves looking at the customer segments over time to observe how their behavior changes. As it relates to subscriber retention, a cohort analysis would examine retention (and churn) over time for each group of paying subscribers that signed up in a given month.
Cohort analysis helps understand how your subscribers have changed over time. It can help you answer questions like:
Is my monthly subscriber retention rate improving over time?
Are there seasonal trends or other events (coupons, marketing campaigns) impacting my subscriber retention?
Being on top of your subscription metrics gives you deep consumer insights you can use to accomplish your most meaningful acquisition, revenue, and retention goals.
Gain visibility into the subscription KPIs that matter with the interactive analytics dashboards and comprehensive subscription reporting of Recurly. Recurly Analytics provides many reports you can customize to have a 360° view of your subscribers.
How do these KPIs impact your business?
Competing in an increasingly crowded marketplace requires continued innovation and the ability to meet subscribers’ ever-evolving needs and preferences. And tacking these metric can help you find trends in behavior.
Check out this guide with ten proven tactics to help you translate these KPIs into actionable insights for subscription success.