September 13, 2022
How to calculate churn rate: A better formula
TABLE OF CONTENTS
TOPICS
RELATED POSTS


Unlike other business models, subscription-based services rely on a consistent and steady stream of revenue coming from recurring payments. Churn serves as an indicator of customer satisfaction, perceived value, and overall business health.
Understanding and managing churn is crucial for sustained subscription success. Knowing what percentage of customers might not return – and how much revenue they’re taking with them – is key to making informed decisions to improve the customer experience and the financial health of your business.
What is churn rate?
Churn rate, also known as attrition rate or turnover rate, refers to how many consumers stop subscribing to your product or service over a given time period. Think of it as the opposite of your customer retention rate–the percentage of customers who renew their subscriptions.
Analyzing churn gives you valuable insights into subscriber behavior that can help you design targeted strategies for product enhancements, customer retention, cancellation saves, and ultimately strengthen long-term relationships.
Want to know more? Check out this comprehensive guide explaining everything you need to know about subscriber churn.
Churn rate formula
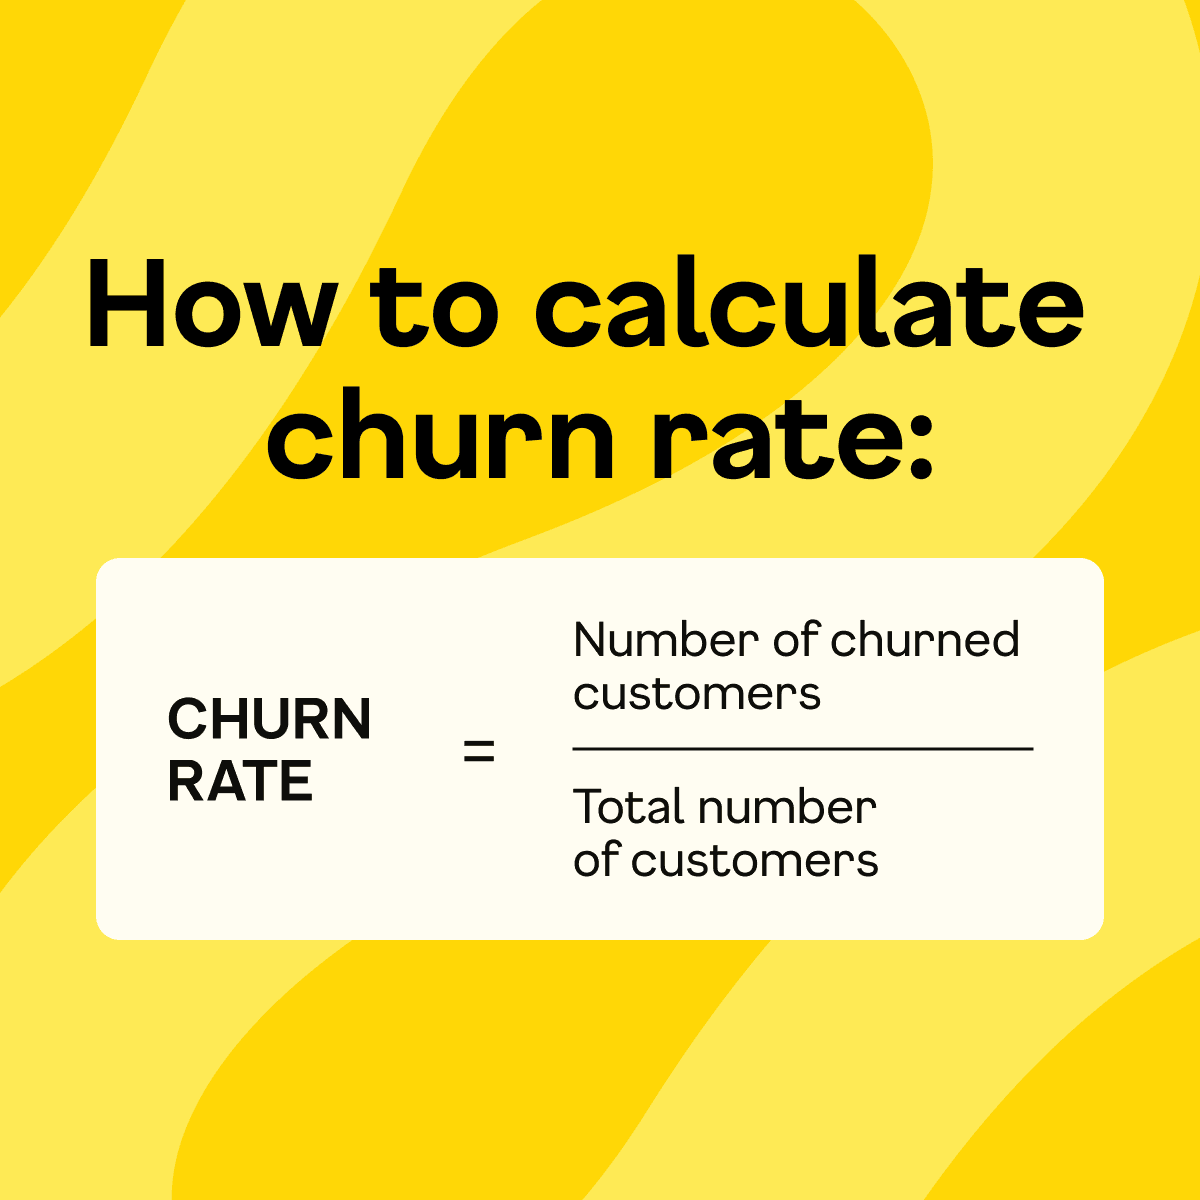
To calculate customer churn rate, use this formula:
Churn Rate = (Total Lost Customers / Customers in the Time Period) x 100
Churn can be measured monthly, quarterly, or annually. While an annual churn rate gives a broader picture of subscriber loyalty, it is largely a lagging indicator. In today’s fast-paced market, waiting a full year for data means missing countless opportunities to take decisive, corrective action. Monitoring monthly (or even weekly) churn is essential for staying agile and responsive to customer behavior in real-time.
Customer Story: See how Scentbird cut churn and boosted personalization with Recurly.
The importance of customer churn analysis
Churn analysis enables businesses to make smarter decisions by actively monitoring churn rate and implementing strategies to reduce it.
It may seem simple like a simple formula, but calculating churn relates to how you count subscribers and activations in the period you’re analyzing. Some companies use the number of customers at the beginning of the month, while others will wait until the end or use an average number.
These definitions can lead to problems analyzing churn, especially for companies with several new customers. Let's look at an example where the same customer behavior in two different months leads to significantly different churn rates.
Customer churn rate analysis example
Let's say you own a fictional subscription box business: Butter of the Month, where customers sign-up to receive a unique, new variety of butter directly to their homes.
Butter of the Month starts July with 10,000 customers. Of this original customer base, 500 leave by the end of the month. But 600 new subscribers joined the community and were active at the end of the month.
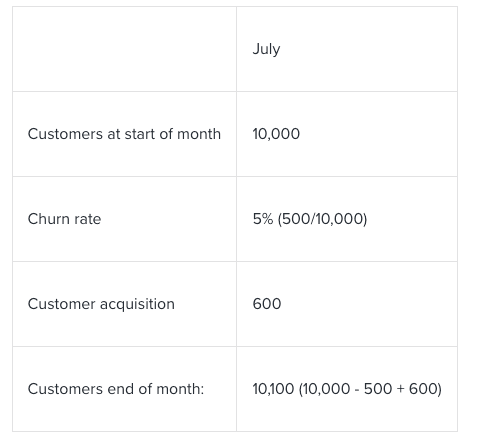
As you can see, Butter of the Month has a 5% churn rate and 10,100 subscribers by the end of July.
Now, let’s imagine they have the same subscriber behavior in August. They start the month with 10,100 current customers, 500 consumers churn, and 600 subscribers join.
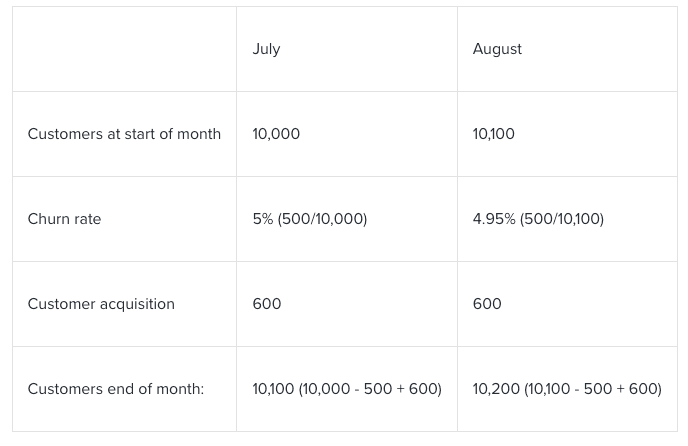
It looks like churn went down in this time frame! However in reality, churn would slightly increase because the company grew, and new subscribers tend to churn at a higher rate.
Regardless of your methodology for calculating churn, the real value lies in cohort analysis and analyzing changes in churn over time. For example, you could segment Butter of the Month into subscribers less than six months old vs. older than six months and track the behavior for both cohorts.
Get more insights: Check out this blog article about why churn analysis matters for subscription businesses and get best practices to do it well.
Video: Defining and calculating churn rate
To get a better picture, Brian Geier, Recurly’s Director of Business Intelligence, explains step-by-step how to apply the churn rate formula to your business. Using the Butter of the Month example above, we dive deeper into the churn calculation process and the importance of cohort analysis.
Customer churn rate vs. revenue churn rate
When talking about churn, you may encounter the term revenue churn rate. Customer and revenue churn are related but distinct at the same time.
While customer churn refers to the number of customers you lose over a period of time, revenue churn refers to the percentage of revenue you lose due to churned customers over a period of time – this can also include subscribers who have downgraded their subscription. (Now, if you lose subscribers but your revenue goes up, that would be a negative churn rate. When that happens, it means your business is making more from a smaller customer base, potentially indicating that you’ve hit the right customer segment.)
The revenue churn rate formula goes like this:
Revenue churn rate = (Revenue Lost to Churn / Total MRR in the Period) x 100
Let’s calculate Butter of the Month’s revenue churn to understand better. Imagine you have two different subscription plans at different price points:
Basic Spread = 6,000 customers paying $20 a month = $120,000 MRR
Premium Spread = 4,000 customers paying $50 a month =$20,000 MRR
Considering this, Butter of the Month has 10,000 customers and $320,000 monthly recurring revenue (MRR) at the end of July.
If we know that 500 customers are churning – 400 basics spreaders, and 100 premium spreaders – we can calculate July's revenue churn like this:
Basic plan revenue churn: 400 x 20 = 8,000
Premium plan revenue churn: 100 x 50 = 5,000
Total revenue churn: (8,000 + 5,000) / 320,000 x 100 = 4.06%
As you can see, we get a 5% customer churn rate but a 4.06% revenue churn rate for July. Even though 500 customers parted, the higher churn rate is at the basic tier, affecting less revenue–in this case.
What is a good churn rate?
Recurly's benchmark report shows that3.27% is the average churn rate in subscriptions across all industries with the average voluntary churn being 3.27% and average involuntary churn being 0.86%. However, churn varies widely across industries and business models.
Netflix, for example, has around 1%-3% monthly churn rate, meaning that almost 97% of customers choose to stay. Spotify has a reported churn of 3.9%, while Peloton has a 1.41% monthly churn. It really depends on your product, sales cycle, industry, competitors, and more factors.
Knowing how you compare to others in your segment is an invaluable tool for gauging the health of your business. Additionally, by understanding the factors contributing to subscriber churn, you can formulate effective strategies to defeat it.
How does your business compare? Take a look at Recurly’s churn rate benchmark report to get comparative data by subscription model, industry, audience, and price point.
What does a high churn rate mean?
A high churn rate indicates you're struggling to retain subscribers. High churn rate numbers can translate into negative implications, such as revenue loss, increased customer acquisition costs, reduced customer lifetime value (LTV), and a potential lack of product-market fit.
Keep in mind that not all churn is the same. Customer attrition can be either voluntary or involuntary–the difference relies on whether the subscriber chooses to quit the service.
Voluntary churn happens when a customer proactively cancels their subscription, for any of the following reasons:
Customers don’t get flexibility or customization options for plans, billing, payments, pauses, or cancellations
Subscribers aren’t receiving the value or convenience they expected from the product
Consumers no longer need the service they originally subscribed to
Involuntary churn occurs when the customer doesn’t want to cancel, but an external factor – usually an unprocessed payment – disrupts the subscriber experience. These payment interruptions are often caused by:
Outdated information from the subscriber’s payment method
Unsuccessful or inaccurate payment retries
Ineffective dunning strategies
Churn is a fact of any subscription-based business. And while you can’t eradicate it completely, you can definitely work towards a healthy amount of churn.
Nowadays, subscription management and recurring billing platforms like Recurly, offer an extensive amount of smart churn management tools that drastically reduce voluntary and involuntary churn–intelligent retries, automatic account updater, and dunning campaigns.
Tracking churn rate easily with Recurly
Now that you’ve learned how to calculate churn rate, it’s time you learn how to track it for your subscription business. Measuring monthly churn rate is an extensive task, especially when done manually. Leading subscription brands, like FindMyPast and Output, rely on a subscription and billing platform like Recurly to automatically identify, analyze, and fight churn.
Recurly Analytics helps you analyze the behavior of your customer base–from acquisition to retention to churn. Our dashboards show churn rates based on plan and churn volume:
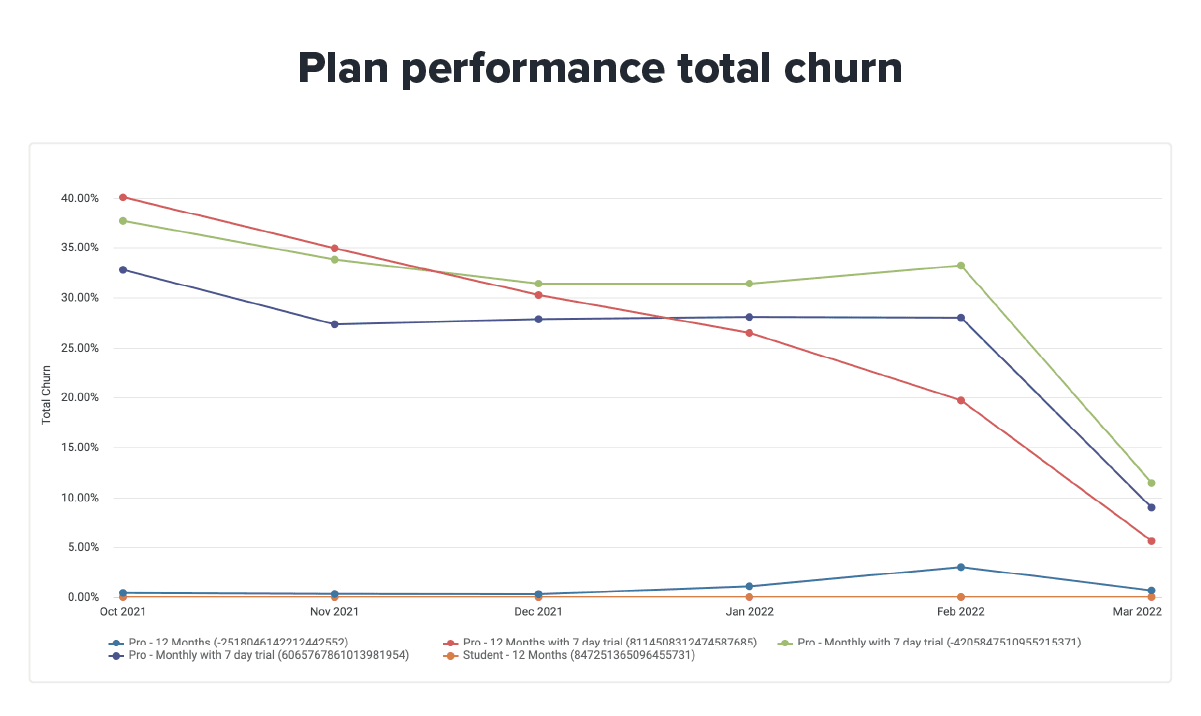
Our Plan Performance Dashboard lets you run cohort analysis to know the number of subscriptions that churned out of each plan–further broken down by involuntary vs. voluntary churn rates.
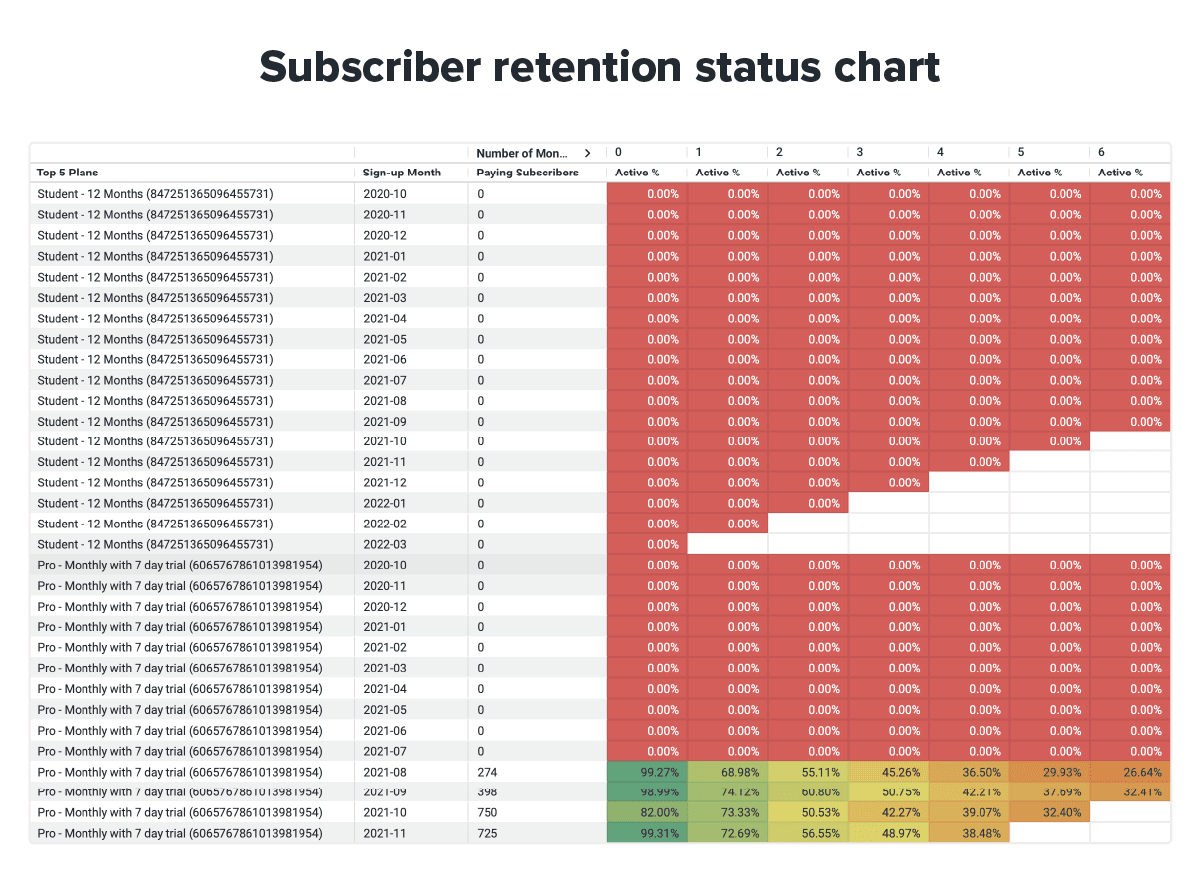
Additionally, our Subscriber Retention view of the Plan Performance Dashboard helps you track activity and churn volume from paying and active subscribers for the numbers of plans you select.
Our latest innovation, Recurly Compass surfaces the most important metrics on churn for your business and offers specific playbooks to combat different types of churn.
Explore these features firsthand with a free trial or request a demo.
Churn rate is one of the most important metrics in subscription analytics, due to its direct impact on long-term sustainability and profitability. Outlining an effective churn management strategy is key for subscription businesses looking to thrive in today’s competitive landscape.
To help you in this journey, we’ve created this comprehensive guide that helps you cut involuntary churn rate to 1% and boost subscription revenue 11% month over month. Inside, you’ll find:
The key drivers to reduce your churn rate – voluntary and involuntary – and increase your subscription business revenue
How subscribers’ perceived value is affecting your margins and how to respond strategically
Why recurring transactions fail and how to prevent them from happening again
Churn benchmarks broken down by industry, B2C versus B2B, and more
The importance of an expert partner to deploy dynamic retries and effective dunning strategies
How to conduct a cohort analysis to analyze churn behavior with subscriber data and insights
By prioritizing customer engagement and retention, your business can secure their financial stability, build stronger subscriber relationships, and position yourself for sustainable growth.