How to use Recurly to track the success of your marketing campaigns

Are you still using basic tools like Google Analytics to measure the success of your marketing initiatives?
If so, you’re probably struggling to truly understand the ROI of your various marketing initiatives. This is because tools like Google Analytics can only measure how many people visit your website, and they aren’t built for understanding things like how many customers you get from each campaign, what the average revenue per user (ARPU) is, and how much monthly recurring revenue (MRR) the campaign generated.
Fortunately, there is a solution. In this article, we’ll outline how you can use reporting tools from Recurly, a subscription management and recurring billing platform, to track which of your marketing initiatives are actually generating paying subscribers.
Why it’s important to track your marketing initiatives in your subscription billing tool
Imagine you run a business that sells project management software. In order to promote your business, you run ads on Google and Facebook.
If you were just using a tool like Google Analytics to measure visitors and goals, you’d probably get something like this:

If this was the only information you had access to–visitors and leads from spending–then it would look like your Facebook Ads were far outperforming your Google Ads and you’d likely direct more of your budget to Facebook.
However, imagine if you could see the results all the way through to the number of customers and the amount of revenue generated. You’d have something like this:
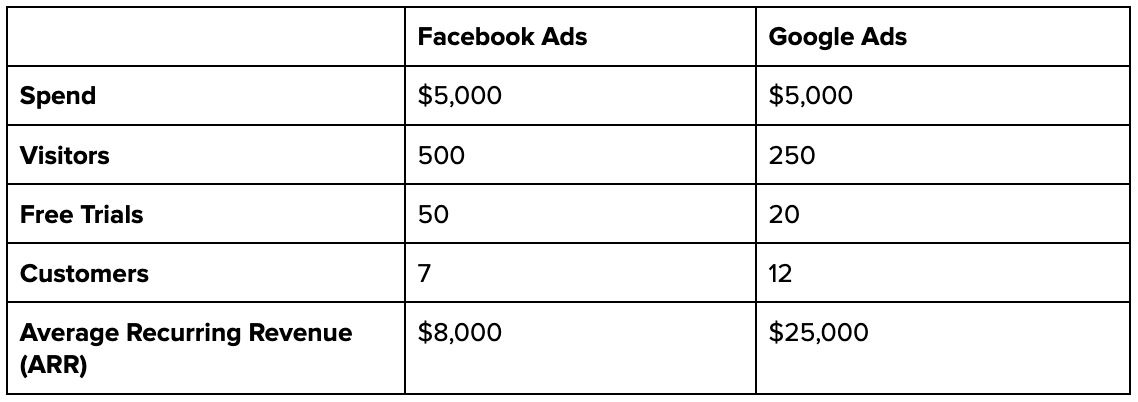
In this case, you learn that your Google Ads are better because:
You got more customers from Google Ads (12) than Facebook Ads (2)
Your conversion rate from free trial to subscriber is higher for Google Ads (60%) than for Facebook Ads (14%)
Your average customer value is higher for Google Ads at $2,083 per customer versus $1,142 per customer from Facebook Ads
Your cost of acquiring a subscriber is lower through Google Ads at $416 versus $714 for Facebook Ads
By tracking the performance of your campaigns all the way through to the number of customers and revenue, you’re able to get the full picture of how they are performing and can allocate your resources accordingly.
How to run marketing reports in Recurly
There are two main steps to running marketing reports in Recurly: ensuring you have the right data in Recurly, and then running the reports. Here’s a guide to both steps:
1. Ensure you have the right data
The first step is to ensure you have attribution data on each of your customers in Recurly (i.e. what channel, campaign, ad group, etc. they came from).
Recurly allows you to add custom fields to Accounts which you can then populate with attribution information via the API, but how do you know where each of your customers comes from in the first place?
That’s where tools like Attributer.io come in.
Attributer is a small snippet of code you place on your website. When a visitor lands on your site, Attributer figures out where the visitor came from and categorizes their visit into a standardized set of marketing channels (the same channels you see in tools like Google Analytics, such as Organic Search, Paid Social, Paid Search, etc).
When a site visitor submits a form on your website (like the signup form for your product or service), Attributer passes the attribution information through with the form submission.
You can append this initial attribution information in your existing API calls to Recurly (like the one you have set up to create a new customer in Recurly) and this data will be stored as custom fields against each customer.
This ultimately means you will have detailed attribution information for each of your customers, which you can subsequently use to run reports.
2. Run reports in Recurly & connected tools
Now that you have the correct attribution information for each customer in Recurly, you can use it to run reports.
The quickest and easiest way to do this is to use Recurly’s built-in reporting tools. With Recurly’s analytics, you can report on metrics like the number of subscribers, MRR, customer retention, and more.

Alternatively, if you’re looking for more advanced analytics, you can connect your Recurly account to third-party subscription analytics tools like Chartmogul and Recurly.
These tools will pull in both your customer and revenue numbers as well as the custom fields you are using for attribution, which allow you to create detailed reports that show you things like:
How many customers you got from your Google Ads
How many customers you got from each Google Ads campaign
Amount of ARR you have generated from your Facebook Ads
The LTV of customers from your Facebook Ads vs Google Ads

Finally, if you have access to data analysts on your team, connect your Recurly account to data warehouses like Snowflake to automatically send all your Recurly data to be analyzed inside business intelligence tools like Tableau, Looker, and the like.
4 reports all marketers should look at
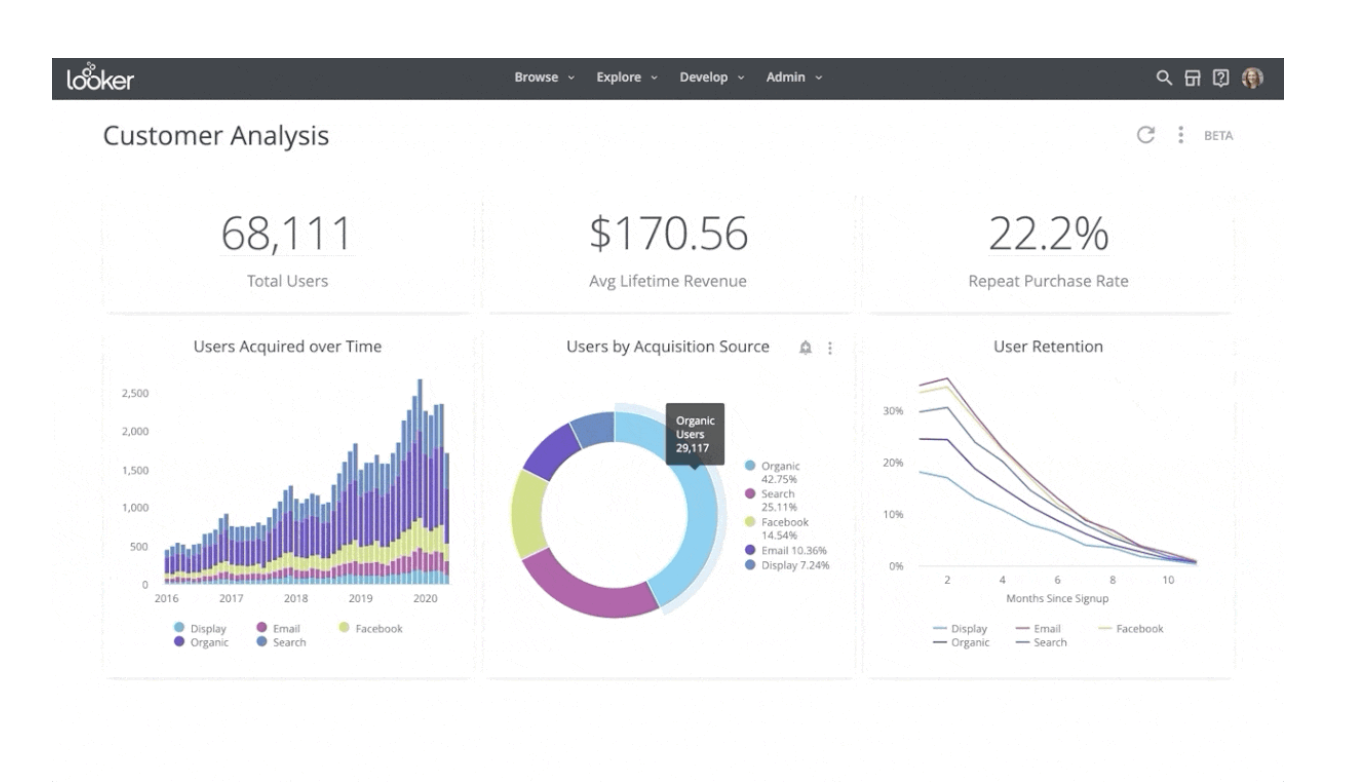
Customers by Channel

This simple report is a great first step toward tracking the full funnel of your marketing campaigns. It shows the number of customers you got each month broken down by the channel they came from, and it can help you see the full picture of your marketing efforts.
For instance, in the above graph, we can see that Organic Search is actually the main driver of new customers for this business–it has been steadily increasing month over month while Paid Search has remained relatively flat.
This could be a good indicator that there is a larger opportunity in SEO than in paid ads, and you may be better off directing some of your resources there.
ARPU by Source

This report shows the average revenue per unit (i.e. customer) from each of your paid sources (i.e. Google Ads, Facebook Ads, etc) and is a good second step in the full funnel reporting journey.
Many businesses apply a blended ARPU number when calculating the ROI of their paid ads (i.e. your average revenue per user is $2,000 and you got 10 customers from Facebook Ads, so your total revenue from Facebook Ads is $20,000).
However, that can lead to incorrect assumptions as not all customers are created equal. Oftentimes, customers coming from Facebook Ads tend to be smaller and churn faster than customers from platforms like LinkedIn Ads, so by understanding the ARPU of each of your paid sources, you can better understand the ROI.
ARR by Campaign
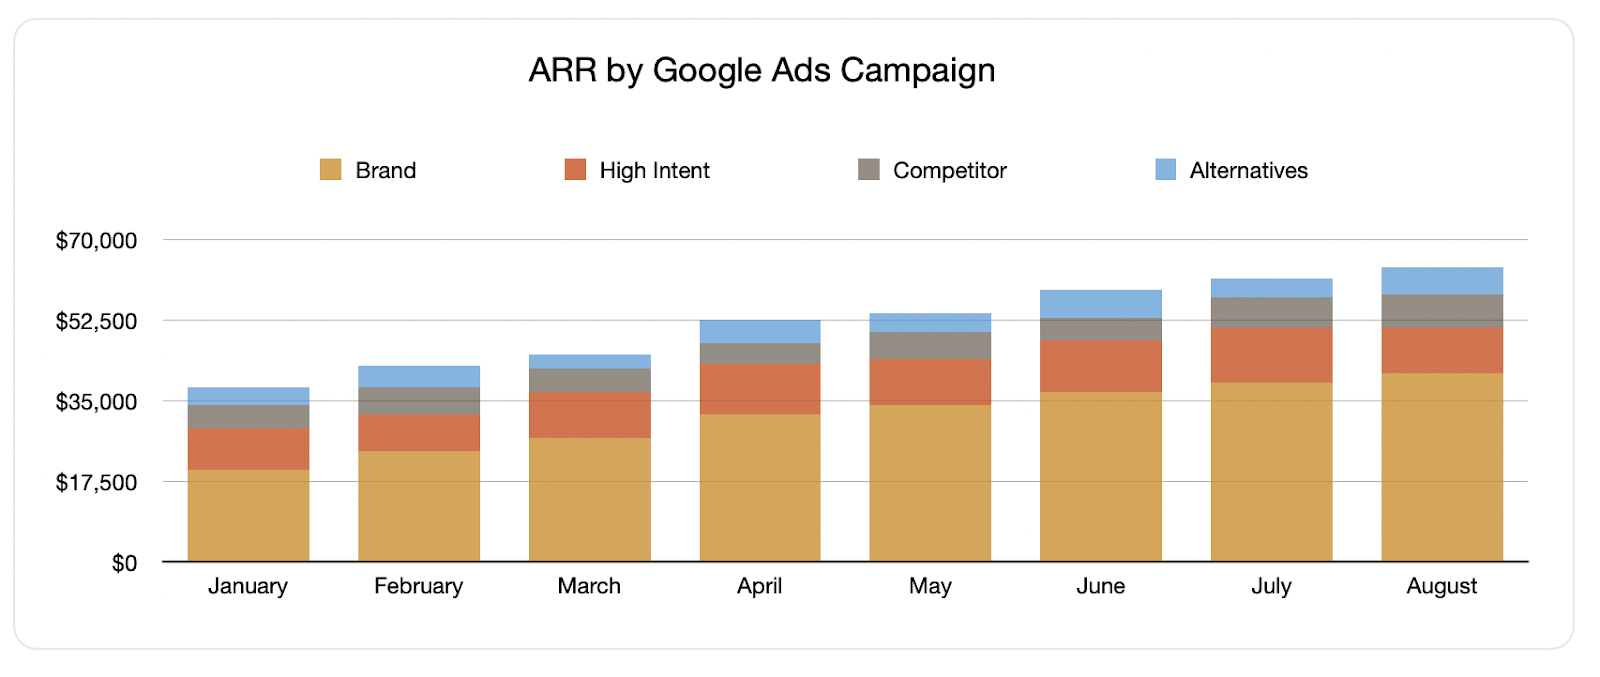
This report shows the new ARR generated each month from Google Ads, broken down by the campaign they came from.
This is a useful report because most businesses run Google Ads targeting a wide variety of search terms with a wide variety of purchase intent, and it’s critical to understand what’s actually working.
For instance, in the above report we can see that in August, the example business generated $70,000 in new ARR from Google Ads. On the surface, this looks great, but when you dig deeper, the majority of it comes from the brand campaign (i.e. bidding on our own brand name). This is problematic because it’s likely these people would have converted anyway by clicking the organic search listing, so you could be wasting large amounts of money thinking Google Ads is working when in reality these people would have converted regardless.
MRR by Content

If you’re like most subscription businesses, paid ads likely aren’t the only thing you’re investing in to grow. You’re probably writing a blog, running webinars, producing ebooks, etc.
And it’s just as important to track how many customers you are getting from these as it is to track customers from your paid ads; otherwise, how do you know whether to keep investing in content marketing or not?
By tracking the landing page of each of your customers, you can run reports on what content on your site is working to attract the right subscribers.
For example, in the report above, we can see that the blog is the main driver of MRR through content while webinars and ebooks aren’t contributing a lot, so it’s likely worth focusing more on your blogging efforts than on other content types.
Wrap up
If you’re a subscription business that is still just using Google Analytics to understand the success of your marketing efforts, you’re likely not seeing the full picture.
To truly understand what marketing campaigns and channels are working, you need to be able to track the source of all of your customers and run reports that show where your customers and revenue are coming from.
Fortunately, with a little bit of work and help from tools like Attributer and Recurly this kind of information can be put in the hands of anyone on your team to empower them to make better decisions to grow your business.