Recurly Research: Subscription Trends and Benchmarks That Provide Insights for Your Business

Most business decisions are driven by data. With a wide range of customers in multiple industries using Recurly, we have enviable visibility into comprehensive subscription data within our platform which gives us a unique perspective. Using this data—which we’ve aggregated and anonymized—we’ve compiled a variety of reports which provide meaningful, actionable insights which you can apply to your subscription business.
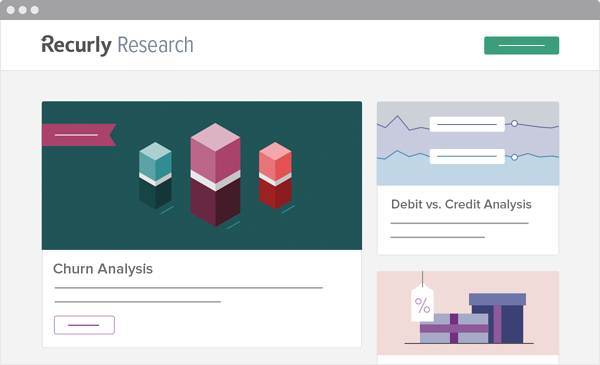
And now, we’ve put all this research into one place which we’ve appropriately named “Recurly Research.” On this page you’ll find things like our recent Churn Analysis and the Debit vs. Credit Analysis which provided decline rates and other trends and stats between credit and debit cards.
Did you miss our Holiday Commerce Research? That’s there too, along with the previous year’s Subscription Retail Report. And there’s our very comprehensive Subscription Snapshot Report which provided a number of statistics and findings based on a our study of 25 million subscription transactions in 2015.
Finally, since we’re regularly publishing blog posts which discuss metrics through various lenses and often provide advice on best practices, we link to those as well.

We know that every business needs to make informed decisions that will allow it to optimize and grow. We also know that we have valuable access to aggregate data that can help subscription businesses make those critical decisions—and we’ve brought this all together as Recurly Research. We invite you to check out our new page here.
And to get our latest benchmarks and research straight to your inbox, be sure to sign up, and we’ll let you know whenever new research is published.


