What is churn rate?
Churn rate measures the percentage of subscribers who cancel or fail to renew within a given period. It is typically calculated monthly or annually depending on your billing model.
There are two types of churn worth tracking separately:
Voluntary churn is when a subscriber actively cancels. It reflects dissatisfaction, changing priorities, or a perceived mismatch between price and value.
Involuntary churn is when a subscriber loses access because a payment fails. It reflects nothing about their intent to stay. A card expires, a bank flags a renewal, a billing limit is hit. The subscriber did not choose to leave.
This page draws on Recurly's network of subscription businesses to give you benchmarks across industries, revenue tiers, and churn types. All figures are updated with July 2026 data.
How to minimize business churn rates: Voluntary vs. involuntary churn
The most useful comparison is against businesses with a similar customer profile, not against an industry average that blends premium B2B SaaS with low-ARPC direct-to-consumer products.
That said, some broad patterns hold up across the Recurly network:
Below 2% annual churn is strong performance across almost any segment. Very few businesses sustain this without active retention and recovery programs.
2% to 4% annual churn is the range where most well-run subscription businesses operate. This is the benchmark zone.
Above 5% annual churn is worth investigating regardless of vertical. It typically signals either a product-market fit issue (voluntary) or a payment operations gap (involuntary).
For SaaS specifically: The Recurly network shows a median overall annual churn rate of 3.04% for software businesses, with top-quartile performers at 1.78% or below.
For B2B: Business and Professional Services on the Recurly network showed a 3.21% median annual churn rate, with best-quartile performance at 1.83%. B2B businesses generally run lower than B2C due to longer contract cycles, higher switching costs, and multi-seat dynamics.
For subscription boxes and direct-to-consumer: Ecommerce on the Recurly network showed a 4.25% median annual churn rate. Lower price points and impulse-driven signup patterns contribute to higher voluntary churn in this category.
For enterprise SaaS: Within the $250+ ARPC cohort on the Recurly network, median annual churn sits at 3.54%, with involuntary churn at just 0.18%. Higher-value subscribers tend to use better payment methods and are more likely to resolve failed payments proactively.
What to look for in your industry
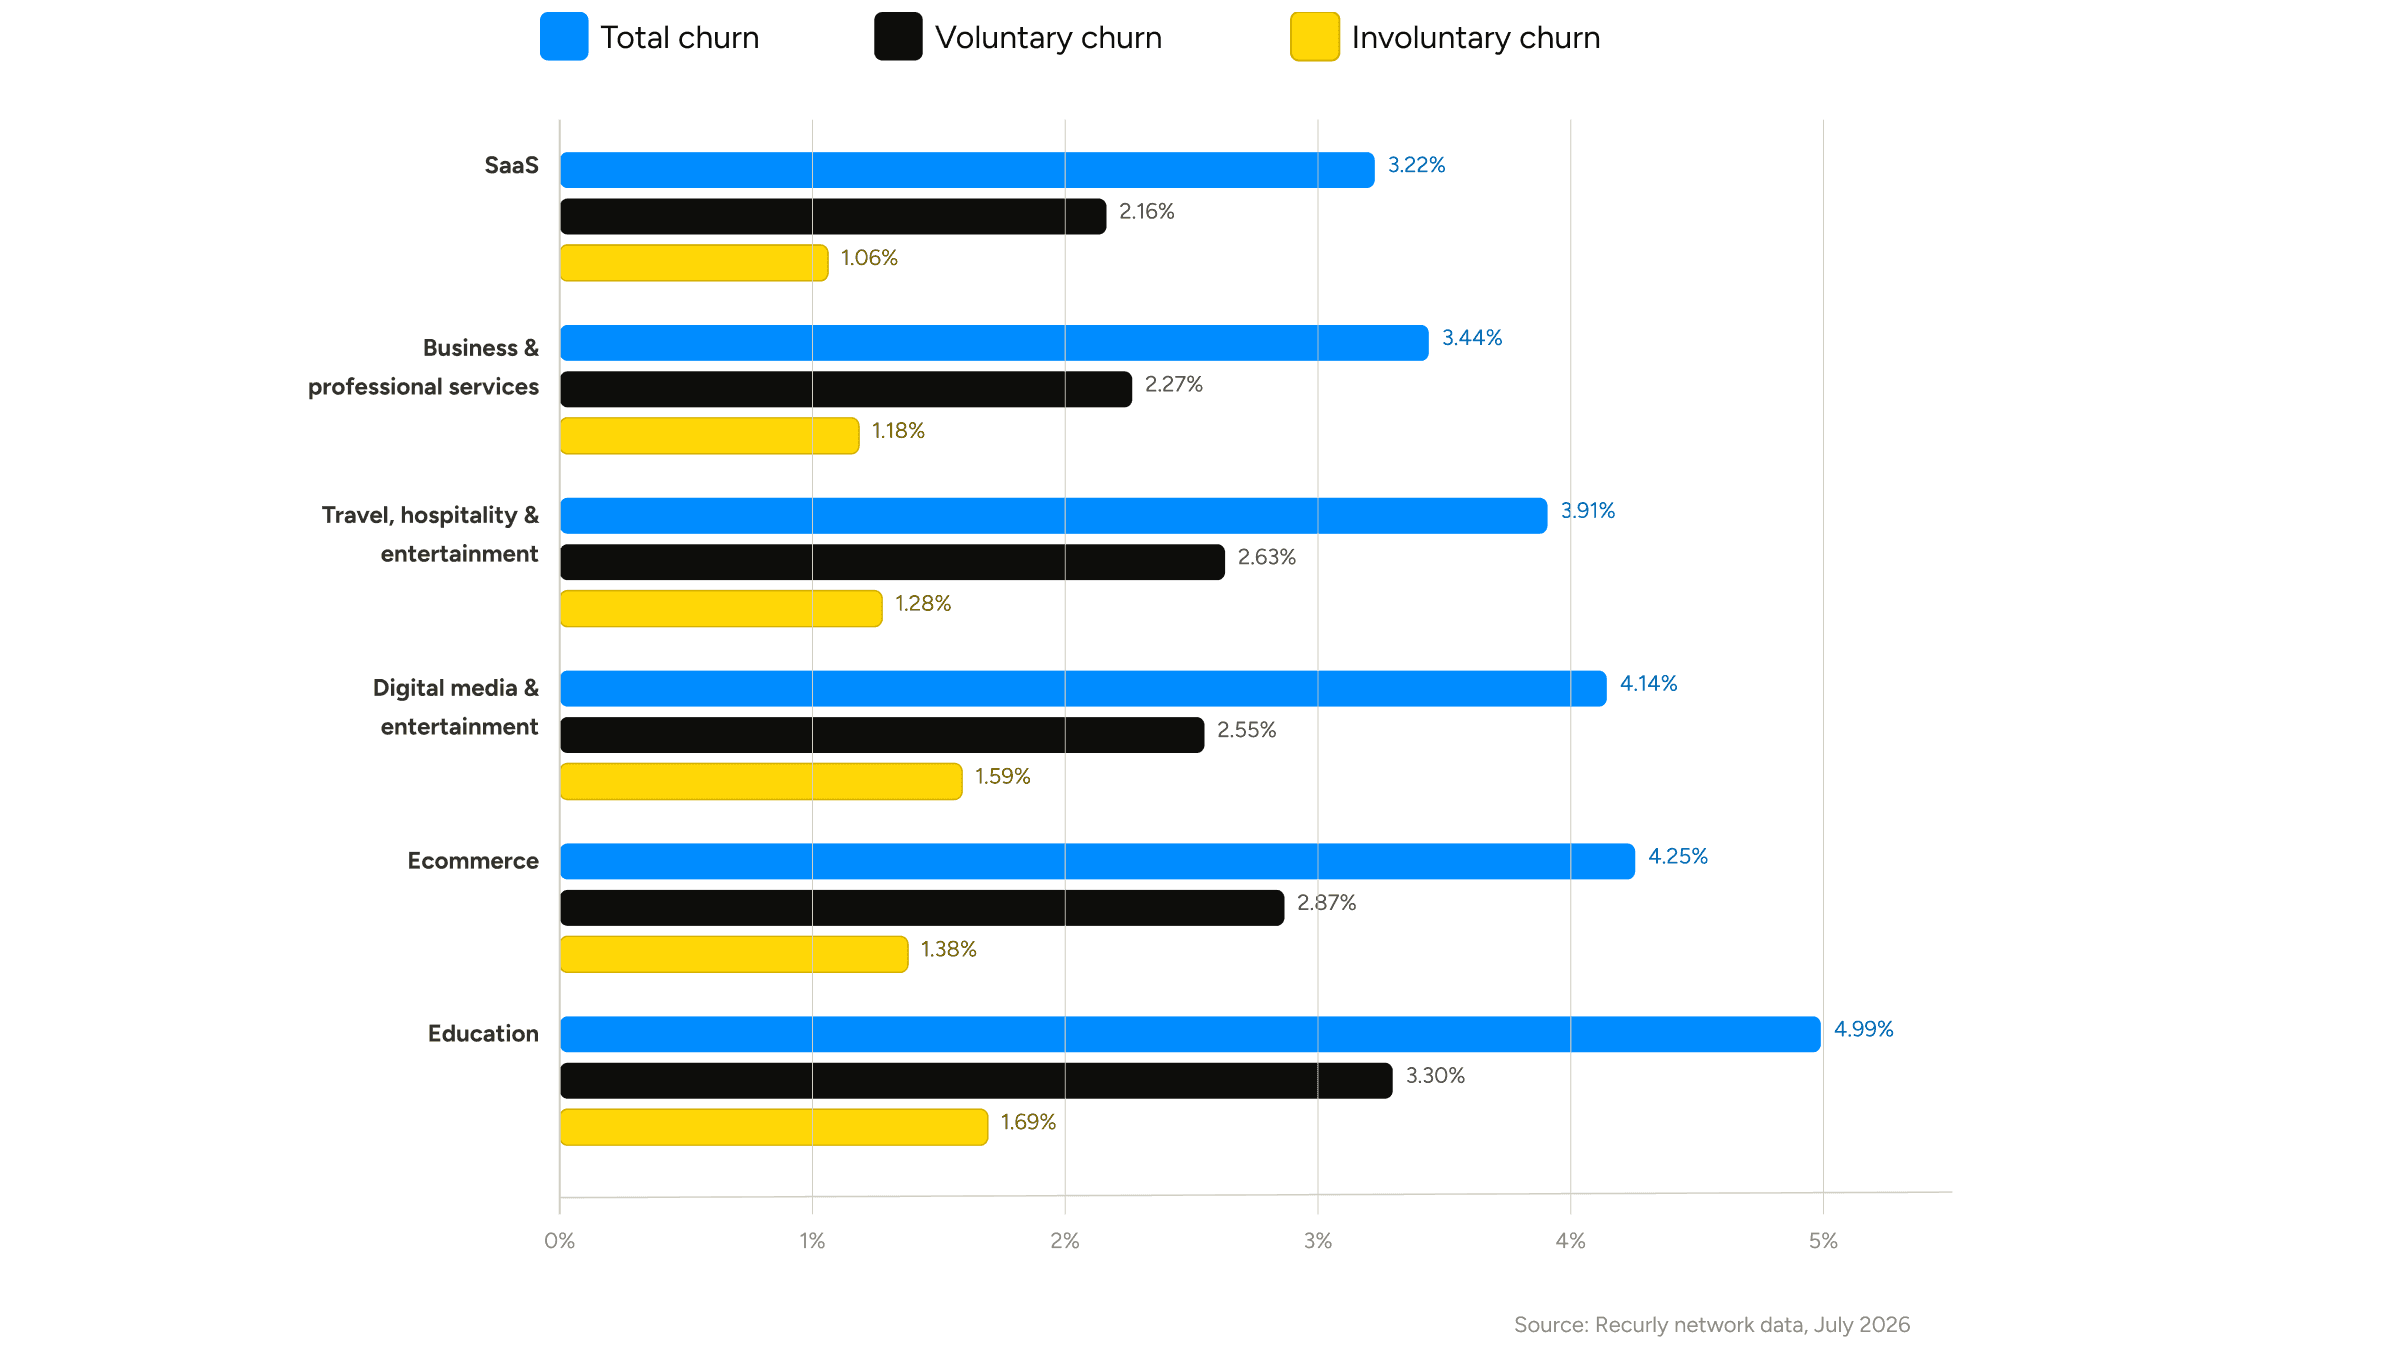
On overall churn, SaaS (3.22%) and Business and Professional Services (3.44%) are the lowest in the dataset. Both also have the lowest involuntary churn, reflecting the higher-value payment methods and more predictable billing cycles typical of B2B subscribers.
Education's voluntary rate (3.30%) is the highest of any vertical, pointing to an engagement and value problem. Digital Media and Entertainment has a comparatively lower voluntary rate (2.55%) but a high involuntary rate (1.59%), which typically reflects a payment recovery gap rather than a subscriber intent problem.
Ecommerce and Travel sit in the middle of the range. Both run higher voluntary churn than SaaS, consistent with the lower price points and more discretionary purchase behavior in those categories.
Take out (Recurly helps its customers recover $1.6B in revenue annually. How much revenue could you recover?)

Involuntary churn vs voluntary churn
Voluntary churn: The subscriber decided to leave
Voluntary churn happens when a subscriber actively cancels. The fixes are engagement and value problems, not billing problems: engagement programs, cancel-save flows, and product experiences that demonstrate ongoing value.
One underused lever is pause. According to the 2026 State of Subscriptions, 38% of consumers prefer pausing over canceling. Brands that offered a pause option saw pause usage increase by 337%, and 3 out of 4 of those subscribers returned within months.
Also worth noting: nearly 1 in 4 new subscriptions now comes from a previously canceled customer. Voluntary churn is not always permanent. Former subscribers can be brought back with the right offer at the right time, which means win-back programs should be treated as a standard part of the acquisition mix, and should personalize their messaging for the specific cohort.
Involuntary churn: The subscriber did not choose to leave
Involuntary churn happens when a payment fails and the subscription lapses. The subscriber may have no idea it happened. Common causes include expired cards, updated card numbers not reflected in the billing system, bank-side fraud flags, and insufficient funds at renewal time. Businesses that invest in automated dunning recover substantial revenue that would otherwise be lost to passive churn. Across the Recurly network:
SaaS recovered $155+ million
Digital media recovered $100+ million
Ecommerce recovered $34+million
Business and professional services recovered $19+ million
Publishing recovered $15+ million
Education recovered $8+ million
Businesses with a 16X ROI on their subscription platform investment tend to treat dunning not as a collections function but as a revenue recovery program with its own KPIs. How much revenue could you recover?
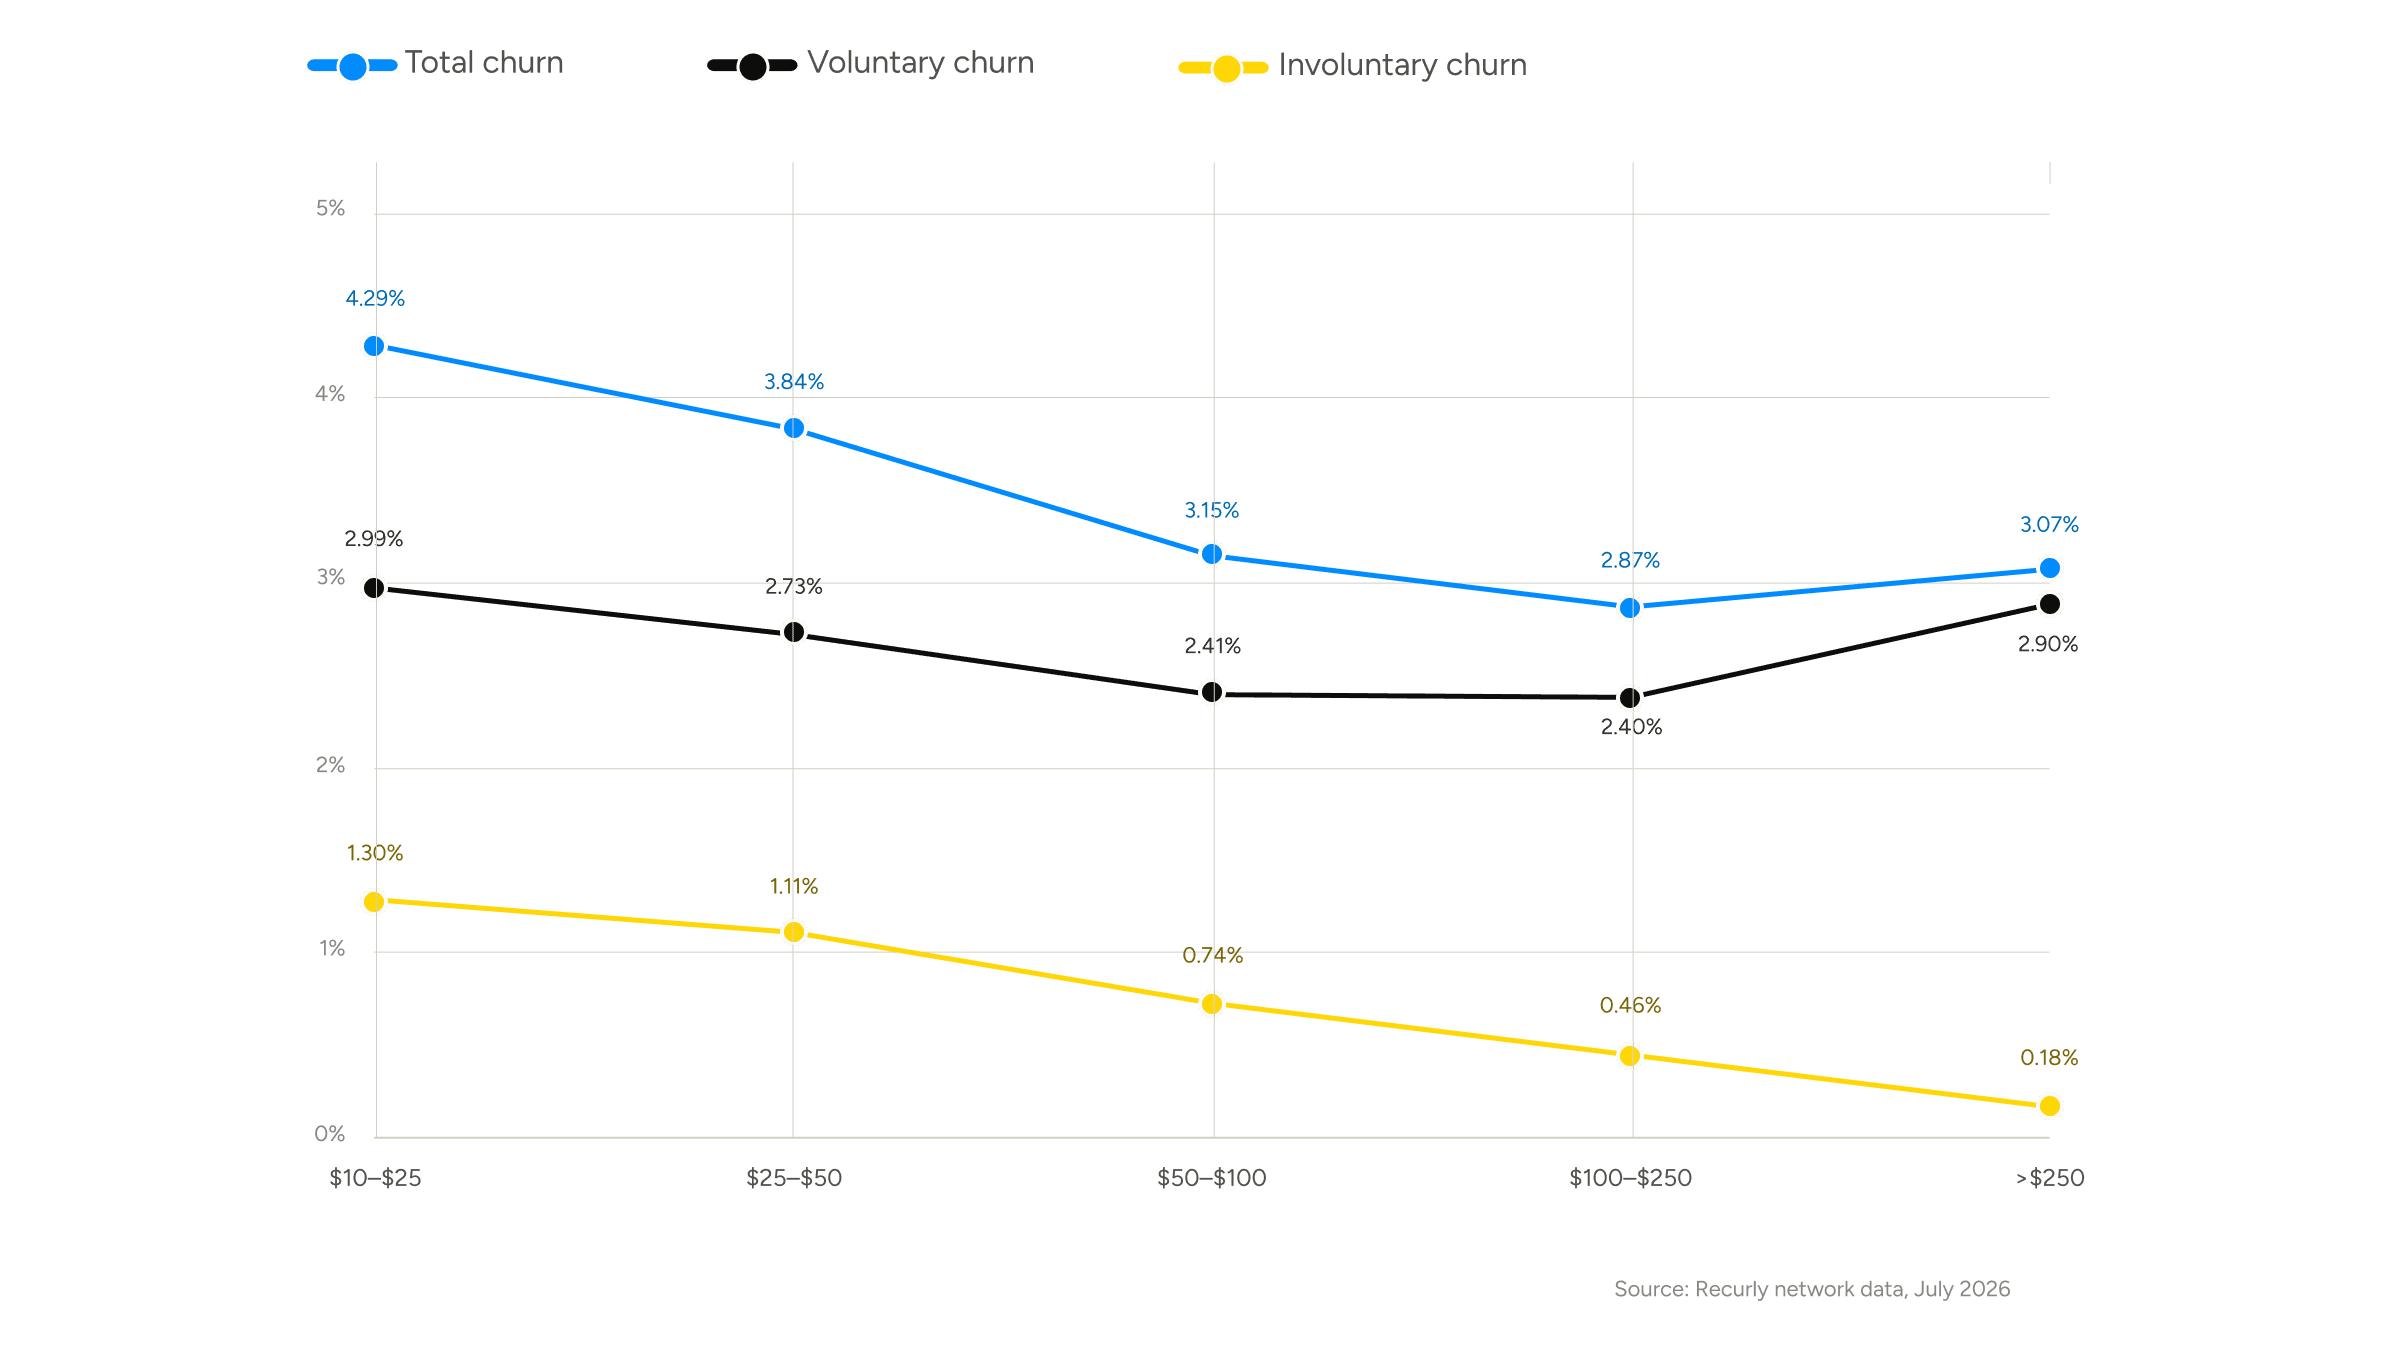
Involuntary churn drops sharply as ARPC rises. At $250+ ARPC, involuntary churn is just 0.18%. At $10 to $25 ARPC, it is 1.30%. For lower-ARPC segments, involuntary churn represents a larger share of the total problem and is often the highest-leverage place to start.
The $10 to $25 band carries the most overall churn risk. This cohort shows the highest overall median (4.29%) in the table. This range often corresponds to consumer-facing subscriptions at a price point that triggers price sensitivity without the engagement depth that higher-cost products tend to generate.

Churn rate vs. retention rate
Churn rate is a loss metric. It is useful for diagnosing problems and benchmarking against external data. Retention rate is a value metric, more useful for communicating health to stakeholders and tracking improvement over time.
Neither captures expansion or contraction of revenue within the subscriber base. For a complete picture, pair churn rate with net revenue retention (NRR), which accounts for upgrades, downgrades, and reactivations in addition to cancellations.
MRR churn rate is a related but distinct metric. It measures the percentage of monthly recurring revenue lost in a period rather than the percentage of subscribers. Because higher-value subscribers who cancel have a disproportionate revenue impact, MRR churn and customer churn can diverge significantly. A business with a 3% customer churn rate could have a 5% MRR churn rate if the accounts being lost skew above average in value.
What drives churn above benchmarks?
Voluntary churn drivers
Low early-stage engagement: The single biggest driver of voluntary cancellations is poor onboarding. Subscribers who fail to realize core product value in the initial weeks are highly likely to drop off.
Fix: Prioritize product usage nudges, structured onboarding, and re-engagement campaigns over discount-led save offers — the issue is perceived value, not price.
Unoptimized plan structure & renewal playbooks:
Monthly plans: Carry higher month-to-month volatility, though failed payments are generally easier to recover.
Annual plans: Offer higher Customer Lifetime Value (LTV) but introduce a high-risk renewal milestone. Running annual subscriptions without an automated pre-renewal engagement playbook leaves a critical retention lever untapped.
Involuntary churn drivers
Passive dunning & fixed retry schedules: Relying on single retries without direct subscriber outreach causes subscriptions to lapse silently.
Fix: Implement intelligent retry logic that sequences attempts by timing, varies charge amounts, and routes transactions through optimal card networks based on specific decline codes.
Unmanaged payment method failure profiles: Different payment methods (credit cards, ACH, digital wallets) carry unique decline patterns that evolve over time. Failing to analyze decline reasons by payment type prevents you from optimizing your recovery logic as subscriber payment diversity grows.